- March 6, 2017
- Public Safety
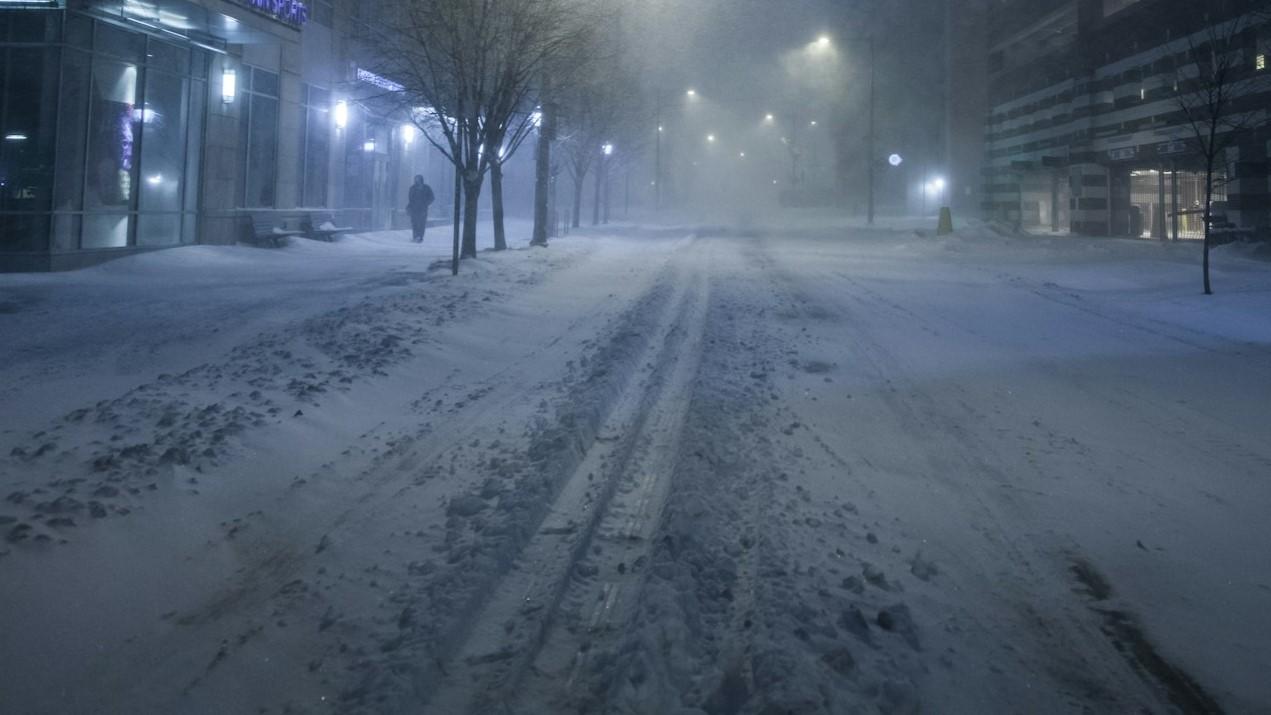
Last December’s blaze at an Oakland, CA, warehouse was the deadliest structural fire in the U.S. in more than a decade. Thirty-six people died during an electronic dance party at the warehouse, which had housed an artists’ collective and was known as the Ghost Ship.
In the weeks after the fire, Oakland city officials released disturbing details of a failed inspectional system that had left the property far below safety standards for many years.

Yet the gaps in information and interagency collaboration that contributed to the fire are hardly unique to Oakland. In the wake of this disaster, every city should reassess how it monitors building safety and addresses fire risk.
Cities can use readily-accessible data to get smarter on building safety. Better data allows agencies not only to track which buildings require inspection, but to apply their limited resources as effectively as possible.
A few cities have already begun to deploy next-generation analytic strategies for prioritizing what they do. In this article, I review the logic behind these algorithms and report on a project they inspired: with my colleague Chris Wheelahan, I used publicly-available datasets to rank every address in Baton Rouge, LA according to fire risk.

Our algorithm, like the Atlanta, GA and New Orleans, LA projects that inspired it, vastly outperforms a business-as-usual approach. It demonstrates that many more cities could deploy predictions to make homes and workplaces safer.
"That warehouse slipped through the cracks”
Just a brief glance inside Ghost Ship would have revealed what former residents called a “death trap:” the warehouse, permitted only for commercial use, was home to at least 10 residents. It contained exposed wire and lacked fire sprinklers. Despite hosting large events, like the concert on the night of the fire, paths through the building were narrow and cluttered.
The city’s inspectors, however, had not entered the building in 30 years, even though the Building Department had received complaints and opened an investigation. As the New York Times reported, the building was “invisible” to the Fire Department, whose inspections list did not even contain an entry for the warehouse.
"I can't answer how that warehouse slipped through the cracks and that it bypassed our system—or how it bypassed the city's system," Oakland’s fire chief told CNN.
Maintaining comprehensive, up-to-date listings of the commercial properties requiring inspections is not a trivial task for fire departments. When the Atlanta Fire Department enlisted data scientists to identify properties that might need inspection, its list suddenly grew from 2,573 to 19,397 buildings.
Still, the challenges of health and safety code enforcement did not satisfy the public in the wake of the Ghost Ship tragedy. “I know they’re understaffed; I know they’re underbudgeted,” one Oakland resident told the Los Angeles Times. “But you have to have priorities.”
Ordering inspections
Even if Ghost Ship had appeared on Oakland’s inspections list, it could have taken years to be inspected. In addition to being short-staffed, a city council member told the New York Times that the Fire Department conducted inspections “hither and yon in no particular order down the street,” she said.
It’s not possible to know whether a place is unsafe without an investigation. But it is possible, in advance, to estimate the probability of a problem, given some additional information.
Estimating probabilities, then assigning resources accordingly, lies behind predictive policing, heralded as the “wave of the future” in law enforcement. The same approach can guide city inspections: in Chicago, for example, using statistical models to prioritize restaurant inspections significantly increased the probability of finding code violations, which meant catching health risks earlier.
For fire departments, Ghost Ship proves the perils of an old-school approach to data. While the National Fire Protection Association assembled its own big data team and called data analytics “a game changer,” just a few cities have used statistical predictions to guide fire prevention. Though some of these systems—including New York City’s FireCast—are proprietary, others have made their methods and results public.
New Orleans, for example, worked with data scientists to develop a tool for predicting the city blocks with the homes at highest risk of fire that were also most likely to be missing smoke detectors. The firm Enigma developed methods for matching information from different U.S. Census datasets, allowing them to extrapolate from recent surveys asking whether respondents had smoke detectors. The New Orleans Fire Department, along with the American Red Cross, used the block-by-block estimates to guide their programs distributing free smoke detectors. This data tool, called Smoke Signals, is available for other cities; Syracuse is rolling out a similar effort.

In Atlanta, the fire department enlisted local Data Science for Social Good analysts to identify commercial properties missing from its inspections list. This new list, as discussed above, was vastly longer than the original one. Seeing the need to prioritize inspections, the department asked for a risk-based list of properties to inspect.
The analysts trained an algorithm to find how attributes like buildings’ size, condition, location, and age had contributed to the distribution of past fires, and to predict future ones. They had hidden a subset of fires—the most recent year’s—from the model, then used those fires to test how well the predictions would perform.

The analysts calibrated the algorithm to rank around 20% of eligible commercial properties as high-risk, figuring the department could manage this number of inspections. If the department randomly inspected this many properties, they would be expected to visit around 20% of the buildings otherwise destined for a fire in the coming year.
The Atlanta team’s model, however, predicted 71%. Their strategy, which they named Firebird, was two and a half times more efficient than the one most inspections departments follow.

Oliver Haimson, an informatics PhD student at the University of California, Irvine who worked on the project, told me one of the project’s biggest surprises was that it seemed to matter little whether the building was old or located in a bad neighborhood. The variables that best predicted fires were those that reflected how many people were likely to be around: a building’s floor size, land area, and number of units.
Needles in a haystack
After reading about Firebird, I wondered whether a similar strategy would work for a city’s entire building stock. Most fire deaths, after all, occur in homes. I combed through open data portals for cities where past fires could be identified by type, date and location, and matched with other property-level datasets. My colleague Chris Wheelahan and I chose Baton Rouge, LA.
Baton Rouge, the capital of Louisiana, is home to around 230,000 people and was the 97th largest U.S. city as of 2015. Estimating risk for every address—over 121,000 of them—meant looking for needles in a huge haystack. Of those addresses, just 194 had reported a building fire in 2016.
Here is what 194 points looks like, enlarged (for visibility) against a backdrop of 121,000 points:

We wanted to test how well a model, trained on 826 fire incidents from 2012-2015, could predict those 2016 fires. We briskly assembled data on each property for predictors including lot acreage; zoning type; assessed value; value of improvements; recent crime; and the surrounding population density. We tested a few machine learning algorithms and got our best results with a random forest model. (See this blog post for more technical details on our methods and findings.)
The model yielded a long list of estimated probabilities—one per address. One of the stronger predictors appeared to be the relationship between the size of a property and its assessed value. This makes sense: a small, low-value property is probably not in great condition and may be more fire-prone. At the same time, larger, higher-value parcels are likely to have more occupants.

How successful were the predictions? Using a common criterion for evaluating prediction models, ours (area under the curve = 0.81) scored just below Firebird’s (0.824). That score reflects how many fires the model predicted correctly, compared to the number of false alarms it produced.
What does the score mean, in practice?
Suppose Baton Rouge set up an outreach program that visited, on average, four buildings per workday—1,000 per year. Selecting buildings in no particular order, we would expect the team to visit one or two properties (1.6, to be precise) otherwise destined for a fire.
If the team used our algorithm, according to our tests, it would hit 29 properties destined for a fire. The program would anticipate 15% of fires while prioritizing less than 1% of the total addresses.

For single-family properties, the team might educate residents and offer fire detectors or voluntary inspections; apartment buildings, dormitories and other larger properties might warrant fire department walkthroughs, safety presentations, or other enhanced procedures. The area is ripe for innovation: perhaps simply sending letters to the 20% of properties with the highest predicted risk would be a cost-effective intervention, considering this group contained 63% of actual fires in our test.
Enabling the predictable city
These results show that any city can venture into predictive analytics—not just the biggest cities with the biggest budgets. This first iteration of our research took just a couple of person-weeks, using free statistical software (R and Python) and a handful of datasets that almost every city already collects.
For Warren Kron, Baton Rouge’s GIS manager, the project addressed a question that has been on his mind after years of assembling city and county data portals: “We’ve got all these data. Now what’s next?”
Predictions, however, are just one step towards preventing fires. The Baton Rouge Fire Department is not authorized to inspect typical residential properties, so the strategy might have to differ from Atlanta’s. As we have begun to discuss with city officials, city housing inspectors or community health workers could be key partners. New legal tools might be necessary. Changes like these require patience, collaboration and political will.
Using predictive algorithms, moreover, is likely to raise eyebrows from residents. Some may, rightly, wonder why they have been singled out for intervention. This process requires transparency and clear communication.
Such challenges will certainly deter some cities from wading into predictive analytics. But more ambitious cities will see the benefits of switching away from delivering services “in no particular order.” For these governments, predictions could inform a more strategic approach. While they won’t prevent every Ghost Ship, they could help stack the odds in favor of safety.
A recipe for property-level fire predictionsThis article describes the author’s project that predicted fire risk for each of 121,000 addresses in Baton Rouge, LA. The project relied on datasets publicly available from the city. Below is a generalized guide to developing a fire prediction algorithm. |
|
Ingredients Datasets: A “master list” of properties and their locations (either street address or latitude/longitude) Data about the basic attributes of each property, including size (e.g., lot acreage, building square footage), usage type, and property value Several years’ recent data on building fires, including location (e.g., street address) and year Several years’ recent data on crime incidence — optional Additional geographically precise data that may have predictive power (e.g., building permit applications, foreclosure records) — optional |
|
Preparation (simplified) Step 1: Merge all datasets at the level of individual properties, joining them either using text fields (street address) or geographical coordinates. The result will be a data frame (or spreadsheet) with exactly one row for each property. To allow accuracy testing later, reserve a specified portion of fires (e.g., the most recent year’s) by coding these outcomes separately. Step 2: Apply standard data science methods to set up data and implement and compare models. Model choices may include logistic regression, random forest (and other decision tree ensemble models), and support vector machine. Be sure to include GIS coordinates as predictors. Output should be probabilities. Step 3: Evaluate best model(s) against the fires reserved for testing. Set probability threshold based on departmental resources and objectives. Review accuracy and generate insights: what predictors mattered most? What patterns contributed most to accurate predictions, and how can they inform policy? |
|
Author’s tips Most cities collect significantly more data than this project employed; in many cities, one visit each to the assessor’s office and fire department would yield enough data for an effective predictive model. Sample datasets Baton Rouge master property list Baton Rouge tax roll (filter by property type) Baton Rouge fire incidents (filter by fire incident type) |