- September 17, 2019
- Transportation
A few months ago, in July 2019, the Massachusetts Bay Transit Authority (MBTA) raised fares on one-way subway passes, and the weekly and monthly passes. Although it’s too soon to know how this might affect ridership, cities across the United States have seen a decrease in riders over the past several years. Mobility affordability and equity have become increasingly important issues for cities, as ridership falls and fares increase. But until recently, there was very little information about how low-income riders used public transit, how they responded to fare cost increases, and how equitable public transit really is.
In the U.S., federal policy requires transit discounts for seniors and those with disabilities. However, there are no required discounts for low-income riders, and the few studies that investigated the impact of fare increases on low-income riders found contradictory results. Are low-income riders stuck, with no choice but to pay the increases? Or do they adjust their habits and take fewer trips when faced with fare hikes? Research results were mixed, finding that both could be possible outcomes. Since policymakers and advocates couldn’t rely on these inconclusive results, it set up the research question, “does increasing fares impact people’s willingness and/or ability to take public transit?”
Jeff Rosenblum, PhD candidate at the Massachusetts Institute of Technology’s Department of Urban Studies and Planning, decided to conduct a randomized control evaluation to find out. He wanted to see if providing a 50 percent reduced MBTA fare card to low-income residents in the Boston area affected their usage of public transit. He also decided to engage daily with the study participants through an automated texting chatbot to include their voices directly in the research and understand rider motivation in more detail than previous observational studies. The preliminary results showed that the group receiving the discounted card made about 30 percent more trips than the control groups, and they took more trips for the purposes of health care and social services.
These findings were important for Rosenblum, whose career has been driven by advocacy. He has extensive experience working in transit planning and sustainable travel, and was wary that recent changes in urban mobility, like the introduction of autonomous vehicles and increase in ride-sharing, were occurring without sufficient attention being paid to equity. He was worried that the low-income residents who would be most affected by policy changes and disruptive technology weren’t included at the table and, until his study, policymakers didn’t have rigorous data to inform their work. With increasing interest in evidence-based policymaking, advocates and government officials welcomed his research and helped inform his research questions and methodology.
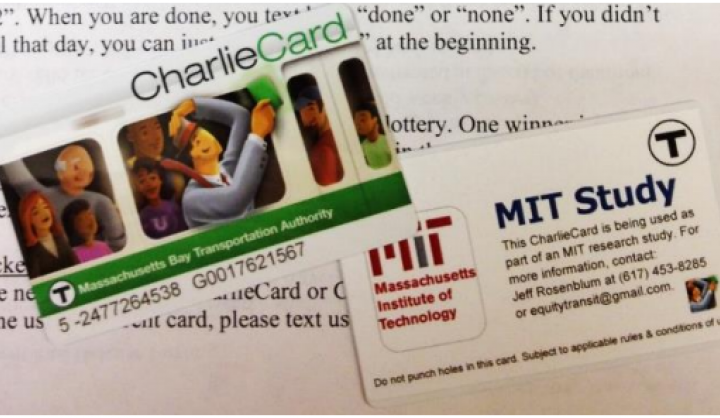
The study began by recruiting participants from the pool of 12,000 Supplemental Nutrition Assistance Program (SNAP) recipients in MBTA-accessible areas. Twelve thousand postcards were mailed to a random sample of SNAP recipients, and advertisements for the study were placed inside buses in the MBTA system. Participants had to be SNAP eligible, in order to know that they fell into a defined low-income bracket, but they couldn’t be eligible for the senior, disability, or youth MBTA discounts. The chatbot was used from the very beginning; individuals who wanted to participate texted with the number for more information and to agree to participate. 240 eligible participants agreed to participate, with the control half receiving a normal Charlie Card (MBTA pass) and the treatment group getting a special card that either deducted half the fare per individual swipe, or could purchase a monthly pass for $29 (33 percent discount). The study went from February to May 2019 and participants could join at any time, but did have to participate for two months.
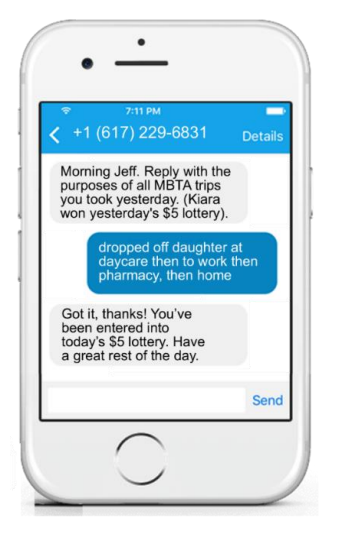
This yielded three types of data. First, the individual Charlie Cards could be tracked using the MBTA data warehouse, which revealed mobility patterns that could be compared between groups. Secondly, pre- and post-study surveys were given to all participants. Lastly, the custom chatbot texted with users, collecting daily travel diaries. Every day at 9AM, the chatbot asked participants to text the purposes of the MBTA trips they made the day prior (or type back “none” if no trips were made). Trip categories included recreation, healthcare/social services, work, and shopping/errands, but the only statistically significant difference between the treatment and control groups was in the healthcare/social services category.
This preliminary data is incredibly useful for anyone interested in transit equity. Not only did low-income riders with discounted fares take about 30 percent more trips, or 2.5 more rides per week, but more rides were for taking care of their health and welfare. As Rosenblum explains, if policymakers and advocates want to tackle historic racism and inequality then understanding the specific needs and uses of marginalized groups is key. Otherwise, decisions are made for the average population or based on assumptions. Also, his work gives low-income riders a stronger presence and, through the chatbot, an actual voice in transit conversations. Rosenblum worries that the newest, loudest players in the mobility scene, such as the new on-demand taxi services and autonomous vehicles, need to be balanced with the amplified voices of low-income transit riders, and his work is doing just that.
Another outcome, beyond the rigorously tested data, is the study methodology. The daily interactions with the chatbot showcased a new way of interacting with low income populations, who are often studied but not engaged. The participatory nature of the daily texting chatbot was not only useful for data collection but was a low effort way for participants to feel connected to the study. Participants responded positively to the tool, with more than 20,000 replies collected over the four months, plus it built trust by having the participants actively engaged in the data process. This type of data collection has a lot of promise, and in the next phase of this research Rosenblum will be conducting follow-up interviews to learn more about how participants felt interacting with the chatbot. Already, the chatbot is going to be involved with other evaluation research and Notre Dame researchers in Seattle are also doing a weekly chatbot to study transit use.
To encourage participants’ responses to the chatbot, everyone who responded to the daily diary prompt was entered to win a $5 lottery. Participants who hadn’t used the MBTA the day before could simply reply “none” and still be entered into the lottery, so there was no incentive to fabricate trips. The MBTA card data could also be used to verify trips, and participants were asked to provide the serial numbers of any other Charlie Cards they may have used during their time in the study.
Rosenblum hopes that this information will be used by a broad coalition of interested parties, including government and advocates around the country. His research shows how important affordability is, and allows more rigorous testing of cost/benefit analysis to find the best policy intervention to ensure transit affordability for low-income groups. Also this study truly helps understand the motivations of low-income riders, which is important for anyone looking to improve mobility equity in their city.
Rosenblum feels that, in general, the higher socioeconomic class of researchers means that they can have trouble understanding the reasons why some low-income people might be motivated to approach transit in certain ways. For instance, buying a monthly pass is more “rational” — cheaper — if an MBTA rider is taking more than 38 rides per month. However, moving away from a monetized way of thinking and instead considering the barriers to purchasing a monthly pass outright can help researchers recontextualize why a low-income rider might spend more money overall by using stored value on their Charlie Card. Rosenblum feels that transit ridership is the perfect opportunity for evidence-based research, since people aren’t behaving “rationally’, a study like this helps researchers ask why, instead of judging. He feels strongly that moving away from the economic determinant way of thinking and considering “rational irrationality” before even designing a study will lead to much better data-driven policies.
The full preliminary report is available here, and Rosenblum will be updating their results in the fall, after conducting qualitative interviews with participants.