- June 23, 2020
- COVID-19
Five months since the start of this pandemic, the GIS community across the world is still continuing to develop new innovative mapping solutions to help with local responses. In two of my recent posts on GIS best practices in local government (see the first post here, and the second here), I highlighted many US-based best practices and just a couple of international examples. In this piece, I wanted to provide some more international examples of how maps are being used to assist in local COVID response efforts:
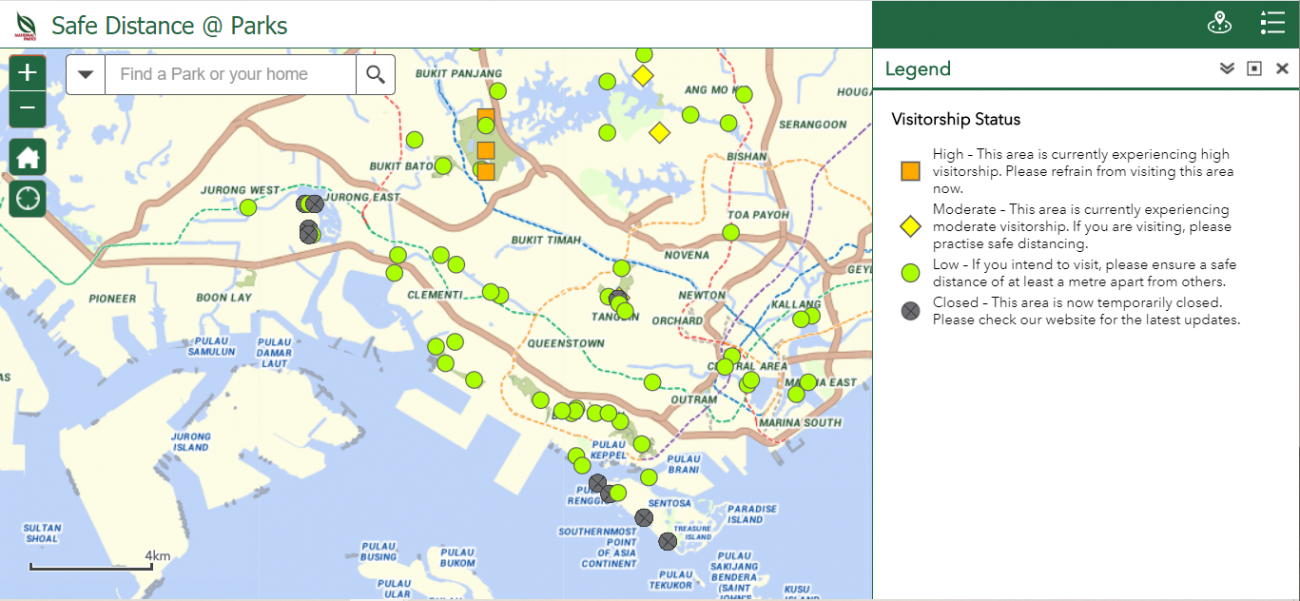
Measuring Public Park Visitor Capacity in Singapore
As the world begins to reopen, residents everywhere will want to go out but may have to prepare for a Plan B, C, or D scenario if too many people are at their original desired destination. To help residents better plan their outdoor activities and get outside safely, Singapore has created a publicly available map highlighting real-time visitorship status of parks. Locals can pull up the map before heading to a particular park to see if there is a comfortable amount of people around, and can find alternative parks to go to if not.
Self-Reporting Health Status and Symptoms in Switzerland
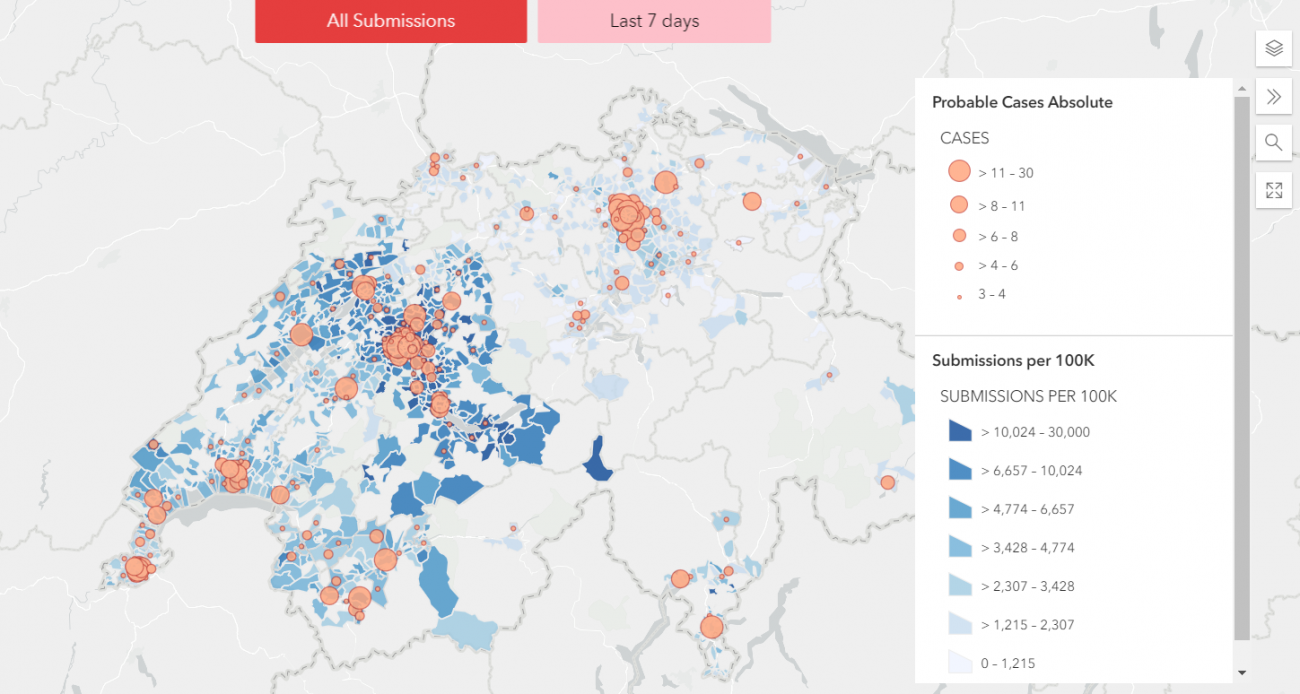
Public health officials in Switzerland knew that if they could identify individuals who are infected (or at highest risk) as early as possible in the outbreak they would have a better chance of stopping its spread and minimizing its impact. With limited capacity to reach and test every single citizen in the country, they built a crowdsourcing application that residents could use to anonymously self-report their health status every single day. In addition to questions about their current health status, the survey asks people what postal code they live in, their age, size of household, their current living situation (i.e., in isolation or not), and pre-existing health conditions. The results are shown on a map (see below), where users can see total cases by zip code throughout the outbreak, as well as self-reported illnesses over the last seven days. Health officials can use this information to see where there are gaps in confirmed cases and areas where people are self-reporting symptoms. This helps officials to stay on top of emerging hot spots and identify targeted areas for intervention.
Cycles for Key Workers in the UK
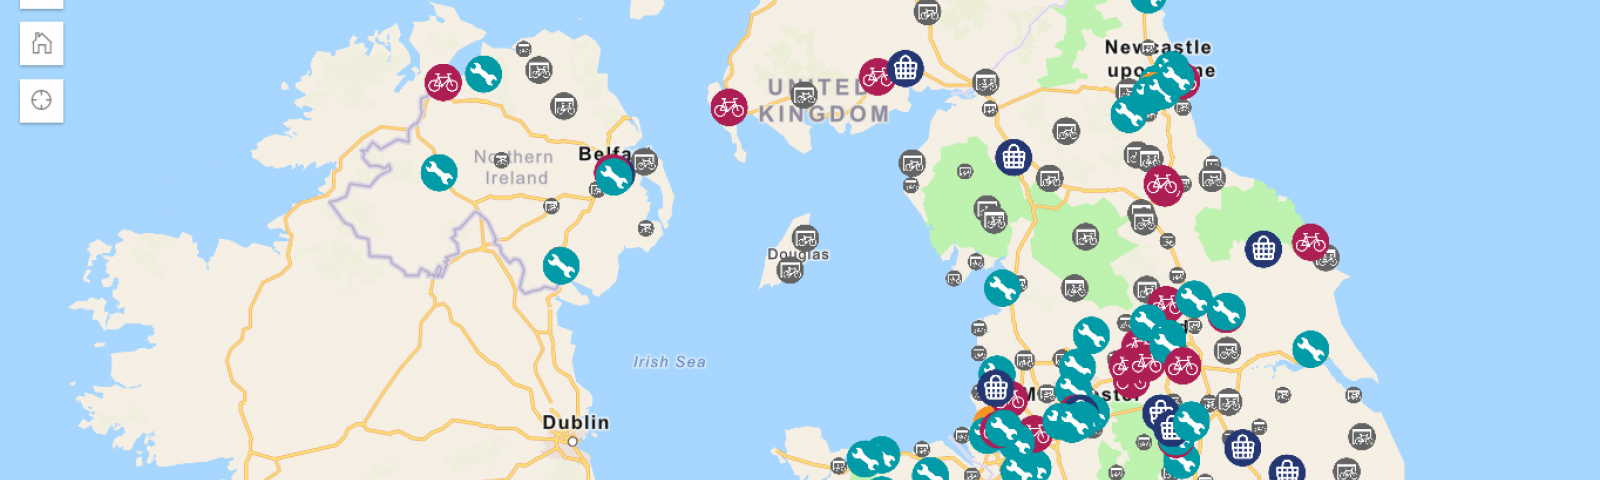
Throughout this pandemic, taking public transportation has been a major cause of anxiety and fear for many because of the volume of people and the number of high-touch surfaces. This is particularly true for essential workers that rely on buses and trains to get to work. As an alternative, commuters all over the world are turning to bicycles to get where they need to go.
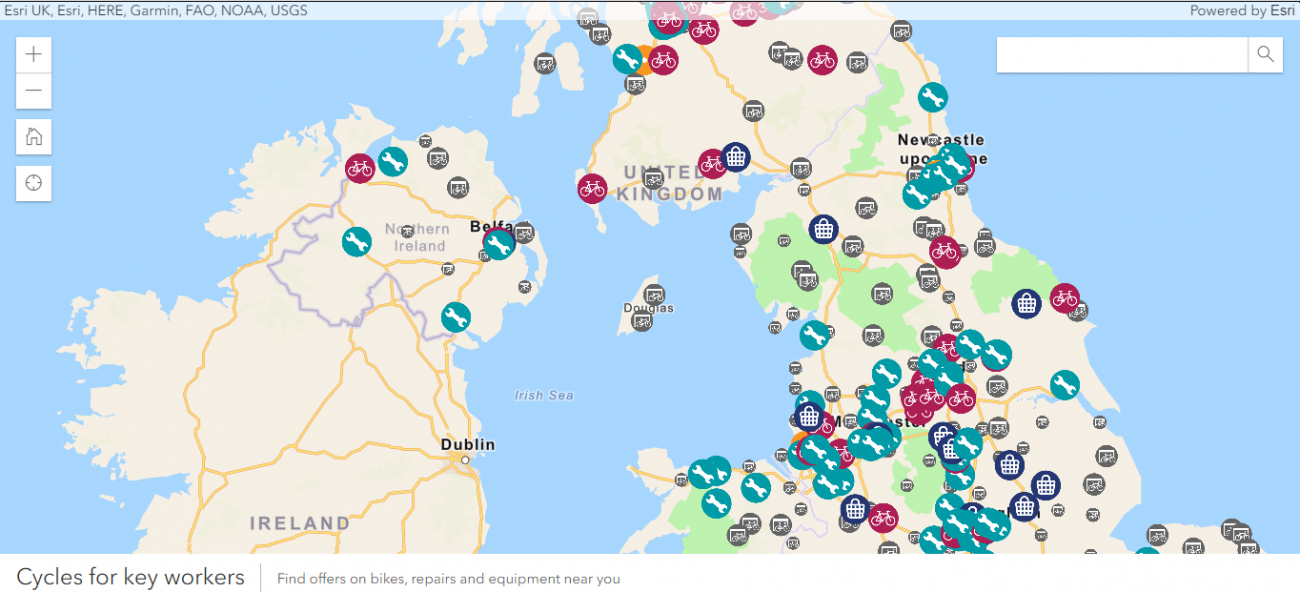
To help essential workers make the transition to biking more easily, government officials in the UK turned to maps. The “Cycles4KeyWorkers” map below highlights the location of open bicycle shops across the UK where new riders can buy or rent bikes, where bicyclists can find equipment, and where they can have maintenance and repairs done. It even helps UK residents locate the best deals and promotions on bicycles and equipment to make biking more affordable.
Monitoring Hospital Wait Times in Northern Ireland for Accidents and Emergencies
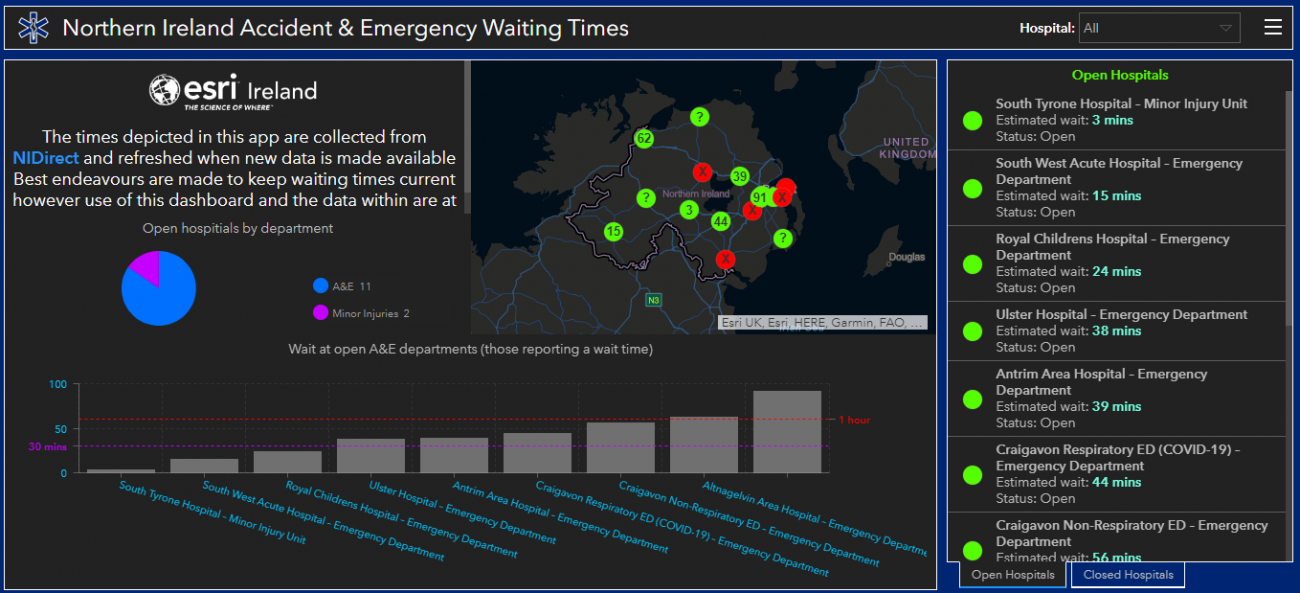
All across the world, hospitals have been inundated with COVID patients, pushing aside other patients or treatments deemed nonessential, and increasing wait times for people that need medical attention for other reasons. To make matters worse, some medical facilities have been forced to close, limiting the options available and further exacerbating wait times. To help people in need of medical attention get a better sense of what hospitals are open and the wait times they will likely encounter upon arrival, officials in Northern Ireland are working to provide near real-time updates of estimated wait times at Accident & Emergency facilities across the region. The dashboard is updated hourly by NIDirect, an official government website tracking and providing access to public sector information and services in the UK. The wait times are displayed in the dashboard below.
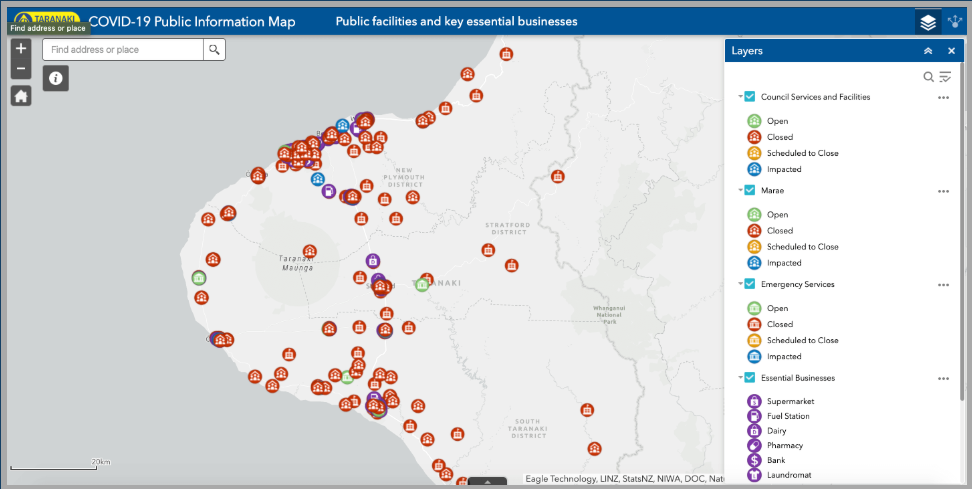
Monitoring Open Status of Public Facilities and Essential Businesses in New Zealand
COVID’s impact on public services and businesses alike continues to change on a daily basis. Businesses closing down or changing their hours can create confusion for residents looking for key services. To help keep people informed about changes in business operations, as well as the location of key services they can still access, officials in New Zealand built a map that categorizes businesses and other services by their open status. It also shows users whether or not the organization’s operations have been impacted (i.e., reduced hours or closures).
These are just a handful of countless examples of how GIS is being applied to COVID responses across the world. If you know of any other innovative examples that you think are worth sharing, please send them to me at matthew_leger@hks.harvard.edu