- March 25, 2016
- GIS
Our #DataSmart Resources series curates links and examples for those looking for an introduction to a particular civic data topic.
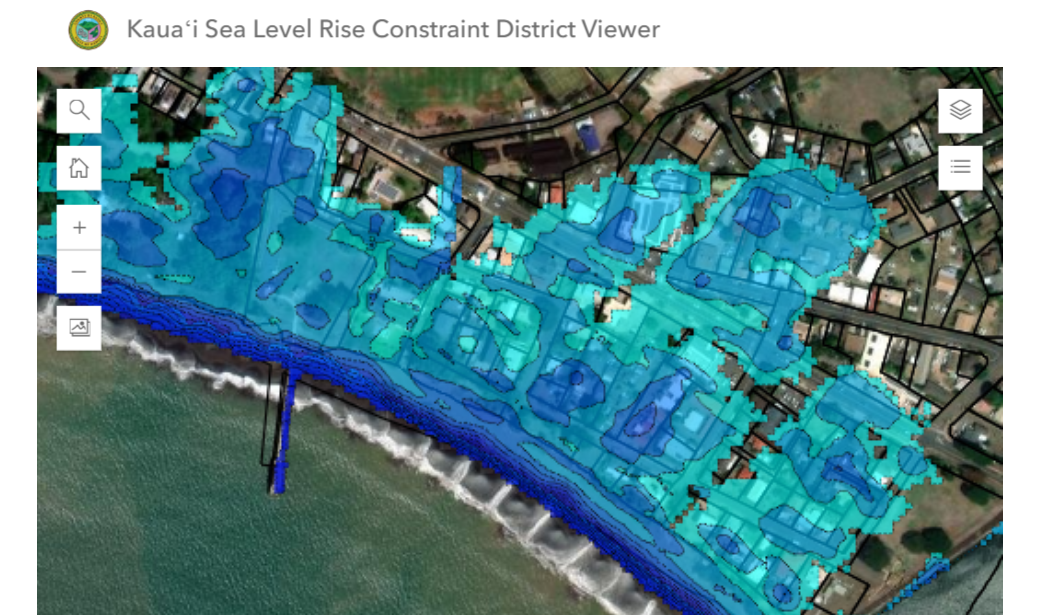
With the proliferation of the open data cities have made available, there is renewed interest in finding ways to make this information more accessible and useful for citizens and businesses. Maps have become a popular and effective way to display the reams of data owned and generated by municipalities. The widespread availability of data from geographic information systems (known more commonly by the acronym GIS) has allowed businesses to better understand their target audiences, police departments to target areas of high crime, and citizens to create maps of the communities where they live.
What is GIS?
GIS is a broad blanket term to describe any technology that helps display, measure, organize, analyze, model, and capture geographic data. The roots of GIS date back to the 1960s with early computing technologies, but the field has made tremendous progress as technologies such as GPS and mobile computing have grown and developed. Everything from off-the-shelf consumer products like Google Earth to complicated remote sensing software (such as ERDAS Imagine) can be considered GIS. GIS can be used to make basic maps displaying relevant data, but it can also be leveraged in myriad ways to benefit organizations.
There are many software packages commonly used for GIS activities, but ArcGIS (made by California-based Esri) is the most widely used for map making and geographic analysis. ArcGIS’s ubiquity has been fueled by discounted costs for educational and government institutions. In 2014, the White House announced that Esri would provide free licenses of ArcGIS’s online product to every K-12 school in the U.S. to help grow geographic literacy among students.
How Do Cities Use GIS?
Beyond providing the software that has helped GIS proliferate, Esri has been on the forefront of helping cities make their GIS data more accessible to the public. In recent years, Esri has teamed up with municipalities to create portals to host their data. Major cities such as Washington, DC and Boston now host their GIS data through Esri’s web services.
Los Angeles and Chicago both recently released platforms using GIS to display open data sets in a more meaningful way. Los Angeles partnered with Esri to build GeoHub, which turns LA's datasets into over 500 different maps that are quickly accessible to citizens with no previous GIS knowledge. Chicago released the open-source OpenGrid, which similarly allows users to select specific datasets and have them automatically visualized on a map for easy consumption. Both platforms allow users to combine maps to analyze data across sets, and developers can easily create new apps to highlight specific issues.
One of the key benefits to GIS data is its ability to layer information. The basic components of GIS maps are files known as shapefiles (the file format developed by Esri that has become the default), and this format is commonly used by local governments when releasing their data. Shapefiles can be comprised of points (to show specific latitude/longitude locations on a map), lines (to display roads or transit lines), or polygons (to show boundaries of cities or census blocks). Each file contains the data (such as population of a given area or the speed limit as a road) as well as geographic locators allowing the data to be correctly placed on a map. Other data from sources such as the census or tax records can be combined with the geographic data to analyze an infinite number of topics.
Here are a few examples of different cities' GIS department websites:
- Alexandria, Virginia
- Austin, Texas
- Boston, Massachusetts
- Chicago, Illinois
- New York City, New York
- Sacramento, California
- Spokane, Washington
- Washington, DC
How Can a Municipality Get Started with GIS?
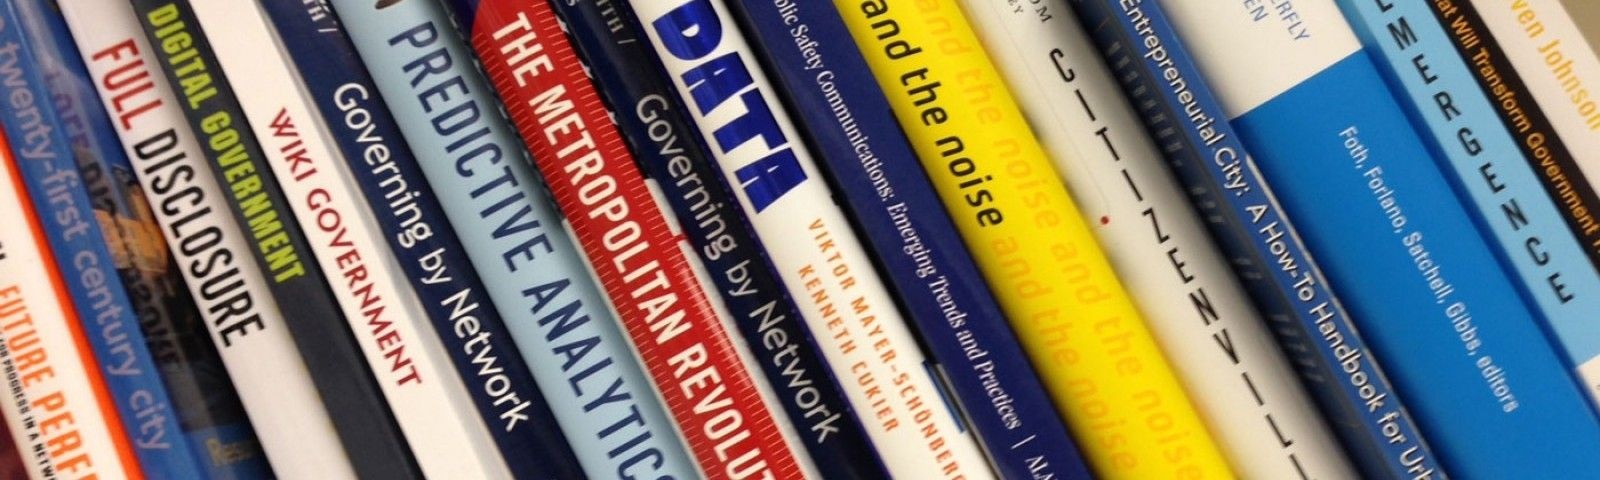
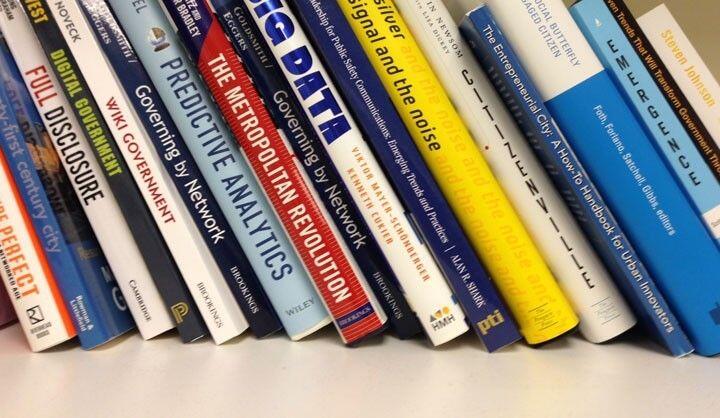
A number of reports and guides are available to explain how local governments can start and further develop their GIS programs:
- Massachusetts Guide to Municipal GIS: This guide (while published in 2002) gives a solid primer on the steps to building a GIS department with a specific focus on serving fellow city departments, database development, software options, staffing strategy, and hardware needs.
- Esri Guide: While not geared towards municipalities, this document from Esri gives a solid background on what makes an organization successful when setting up their own GIS department with respect to operations and governance. Esri also has a book (available for purchase) called The GIS Guide for Local Government Officials that provides guidance and case studies for integrating GIS into local governments.
- City of Alexandria, Virginia GIS Strategic Plan: Cities can find it helpful to develop strategic plans to better understand their goals and milestones for making GIS part of their operations and more publicly accessible. This is a sample strategic plan from the City of Alexandria, Virginia.
An easy option for cities looking to begin their GIS programs could be Chicago's previously mentioned OpenGrid platform. Since OpenGrid is open source, the platform can be easily replicated and launched in other cities with their own datasets.
How Do I Learn to Use GIS?
Aspects of GIS are fairly specialized, and many universities have adopted full degree programs in GIS. However, there are some online resources available that can help someone get started learning GIS now:
- Harvard University's Center for Geographic Analysis: These video tutorials cover a range of GIS topics, from basic ArcGIS usage to more complicated data visualizations and geography topics. The CGA also has a QGIS video workshop, for anyone using the open-source alternative to ArcGIS.
- Harvard Map Collection Tutorials: These videos provide a deeper explanation of basic GIS concepts without delving into information on specific software tools.
- GIS Lounge- Learn GIS for Free: This list contains links to websites, universities, and MOOCs (massively open online courses) that provide free GIS tutorials and courses. Highlights include Esri's free training courses and MIT OpenCourseWare's intro GIS workshop (and the followup course on spatial database management).
Put Yourself On the Map!
The usefulness and applicability of GIS for municipalities cannot be understated. It helps jurisdictions make decisions about land use, better understand demographics, and be accountable to external stakeholders. GIS systems and portals also help residents, developers, and business communities gain insights into where they live or work. Investing in GIS can seem daunting at first for local governments, but it's an investment that will help everyone understand their municipalities and make more informed decisions in their daily civic lives.
This post was originally published on January 13, 2015 and has been updated with more recent information.