- August 3, 2020
- COVID-19
Back in late March when the COVID-19 shutdowns began, state and local governments across the US quickly became overwhelmed in a range of areas. While struggling to meet rising demand for government services, the digital infrastructure in place to support data collection and sharing between government agencies became a choke point for information flows. In some cases, fax machines were a key barrier hampering government responses.
In the face of these challenges, Kentucky’s Geographic Information Advisory Council (GIAC) formed the Kentucky Emergency Management GIS/IT Workgroup (KyEM GIS/IT). This group, made up of eight state agencies, three federal agencies, and two private-sector partners, came together to evaluate the state’s data, GIS, and IT infrastructure needs early on in the pandemic. Their hope first and foremost was to ensure state agencies were collaborating and sharing critical data, but they also wanted to get ahead of these IT challenges to be able to support decision makers with the most up-to-date data and tools. From this working group, one critical need was identified: a dashboard tracking economic impact across the state.
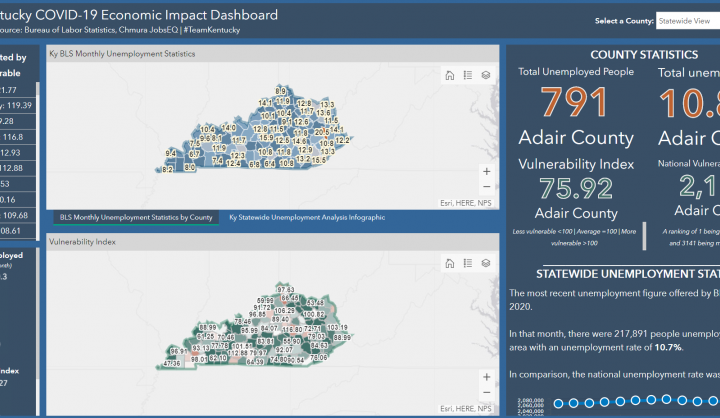
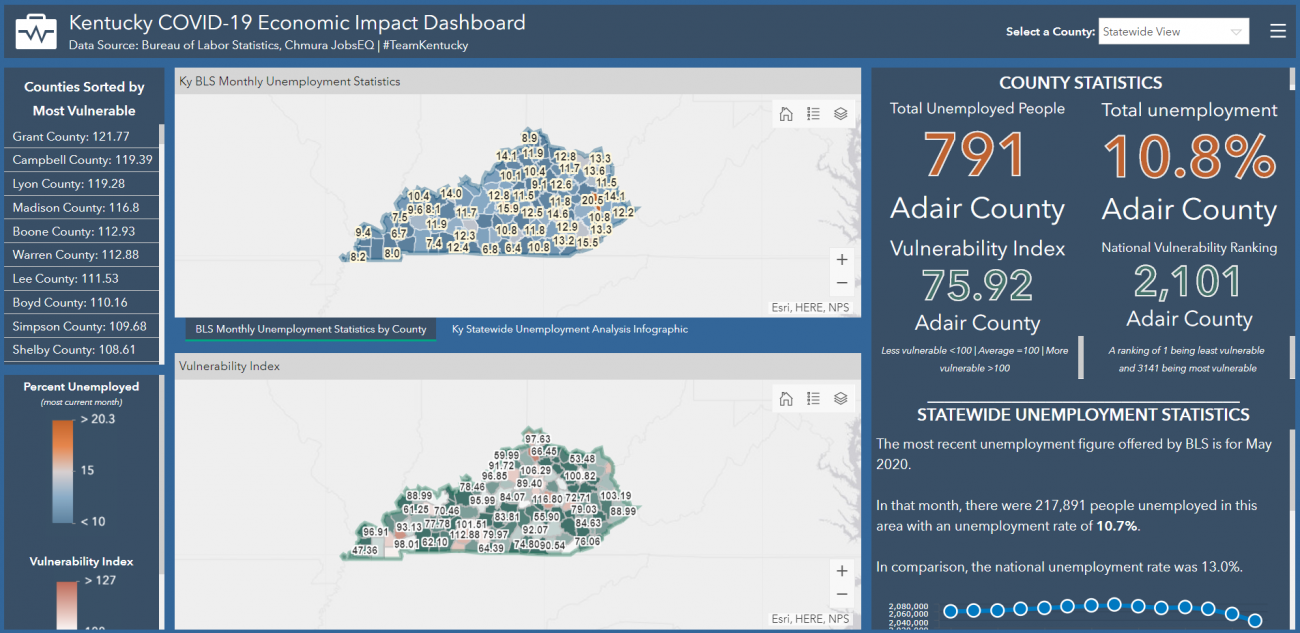
From this, the state’s GIS manager, Kent Anness, and his team built the “Kentucky COVID-19 Economic Impact Dashboard,” a dashboard tracking unemployment rates and economic vulnerability down to the county level (see below). The unemployment rate is based on data from the US Bureau of Labor Statistics, and the vulnerability index is calculated by Chmura, a labor market analytics firm. The vulnerability index measures the potential negative impact of the pandemic on employment. Scores are determined by projected job losses in an area based on the industries that have experienced the greatest job loss nationally.
In an interview, Doug Eades, IT Supervisor for Kentucky Emergency Management (KEM), said that the dashboard sits within the state’s internal COVID-19 hub site, and that its primary use is to maintain situational awareness for state leaders. He also said it is there to help communicate critical employment information across agencies, particularly within the KyEM GIS/IT response team.
However, Eades went on to note that it is being used by several state and local leaders across Kentucky to evaluate the needs of individual economies more closely and to develop policy responses tailored to the unique needs of each locality. Eades described KEM’s use of the dashboard, highlighting the important role it is playing in the state’s efforts to advocate for funding from FEMA for economic recovery. He also highlighted some other key users including the Cabinet for Health and Family Services (CHFS), as well as the Cabinet for Economic Development (CED). According to Eades, CHFS is using the data in the dashboard for strategic planning and staffing purposes to anticipate and meet demand for services in different regions of the state. CED, on the other hand, collaborates with Kentucky’s 15 area development districts throughout the state that have access to the dashboard to inform economic development activities within their respective regions.
In addition to sitting in the state’s internal hub site, the dashboard is also available to the public along with a collection of other maps being used in the pandemic response. Anness noted in an interview that it was important to get this information out to the public, saying, “we learned a long time ago that anything you can share with the public, just get it out there… you never know who else might need your data.” He emphasized that the greatest share of traffic to the dashboard is coming from the general public. For years, Anness and his team have been successfully pushing state agencies to adopt a culture of open data so that other agencies, private or nonprofit entities, or individuals do not have to duplicate data or effort. Dashboards like these also point users to a single, accessible, authoritative source for information.
Of course, data sharing and open data in government comes with its challenges. According to Anness and Eades, Kentucky ran into challenges with government entities at all levels still operating on antiquated software and technology. This has created problems in collecting, storing, analyzing, and reporting the data in a timely enough manner to support decision making in a rapidly changing situation. With the economic impact dashboard, the unemployment data runs roughly a month behind due to unemployment reporting methods used by the federal government, and the vulnerability index does not take into consideration which CDC guidelines that specific localities require local businesses to follow (e.g., mask wearing or social distancing) which may impact a region’s level of economic and employment activity. Ultimately, as noted by Anness and Eades, it is incumbent on the user to decide how to effectively leverage the data at their disposal given its limitations.
Nonetheless, Anness’ efforts to create a culture of open data have paid off tremendously several months into the pandemic. Before the shutdowns, his team had hundreds of layers of data flowing in from different agencies. Having this infrastructure in place positioned them well to support COVID-related response activities for a range of government agencies. For example, when state leaders were looking for accessible locations to set up COVID testing sites, the GIS team had a map of library parking lots and hospitals ready to go. When the National Guard called asking for a map of state parks and lodges to use for first responder housing and other uses, the team already had it. Within a few weeks of the virus reaching the US, the team was able to map all long-term care facilities throughout Kentucky. Having access to this data in GIS platforms has been critical for enabling rapid response and collaboration between agencies.
For Kentucky’s COVID-19 response, the keys to success were twofold: first was the state’s preexisting interagency relationships through the GIAC. This statutorily defined council enabled rapid and constant collaboration between local, state, and federal agencies and the ability to seamlessly share data with critical stakeholders. The other important factor was letting maps and data lead the way. “All successful responses start with a map,” said Anness. “Stakeholders may come to the table with their own understanding or view of a problem at hand, but with everyone operating using the same maps and data, the barriers typically preventing effective cross-agency collaboration start to break down.”
Eades and Anness both gave praise to the power of GIS and collaboration in the worst public health and economic crisis in our lifetimes. Eades concluded by saying, “This was a perfect case scenario of the government coming together and rallying different agencies to leverage their collective expertise and work collaboratively to solve a major challenge facing the public. This is how the government is supposed to work and maps have been key to making it all happen.”