- February 26, 2018
- Data Visualization
Complementing Harvard’s Map of the Month series, each week, Map Monday highlights a data visualization that enhances understanding of or helps resolve a critical civic issue.
By 2022, 17 percent of minimum-wage American workers will receive at least $15 an hour. While cities like Seattle, Los Angeles, San Francisco, and New York City, along with over 30 states (including California and the District of Columbia) have passed legislation that will meet the demands of the “Fight for 15” movement between 2016 and 2021, pushback is increasing at the state level. States like Ohio and Missouri are rolling back local minimum wage legislation, citing the burden of navigating disparate policies at the local and state levels.
January 2, 2018, saw increases to the minimum wage in 18 states, though many were simply meeting the requirements of an inflation index and totaled less 15 cents per hour. Still, with a federal minimum wage of only $7.25 per hour, every cent counts.
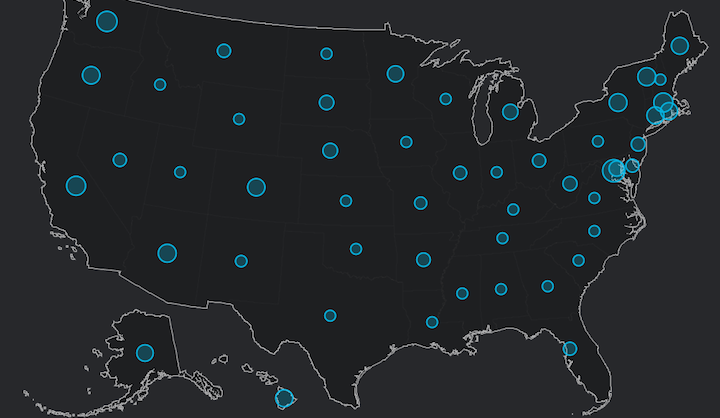
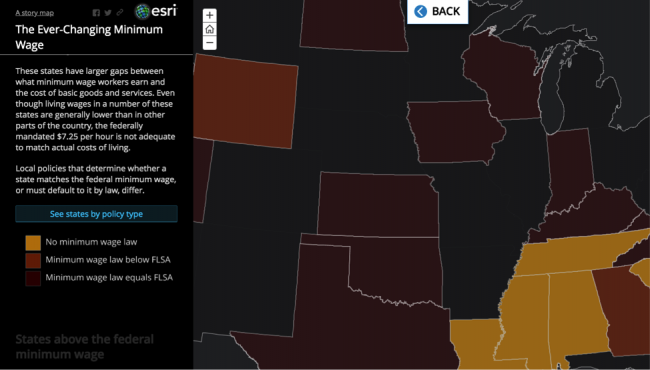
According to a story map by published by Esri, however, these incremental adjustments are failing to meet the surging cost of living across the United States.
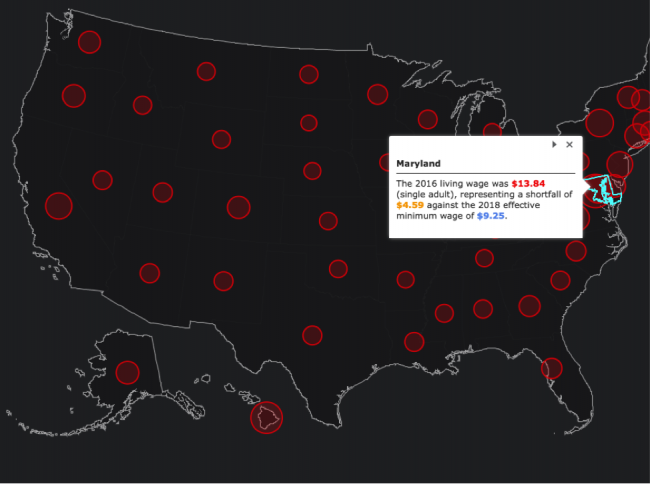
The map illustrates the gap between states’ minimum wage and the living wage, a calculation by a researcher at MIT that weighs the actual costs of housing, goods, taxes, as well as family size and composition, as of 2016. For example, in Maryland, where the 2018 minimum wage is $9.25, the living wage (according to the Living Wage Calculator) comes in at $13.84, leaving workers with a $3.53 hourly wage gap. In Virginia, the disparity is $5.96.
In addition to the state level, the map illustrates the gap between the cost of living and the federal minimum wage (in states such as Utah, Texas, and Florida). The average disparity amounts to $2.64.
States such as Mississippi and Florida, which lack any form of minimum wage law, appear to bear the largest chasm between earnings and the cost of basic goods and services, even though these states tend to have lower cost of living. States that have implemented such policies, on the other hand, indicate a less glaring gap. The implication of this distinction is notable: legislation makes a difference, even in states that aren’t as socioeconomically advantaged.
One of the key challenges, in addition to pushing through feasible and forward-facing legislation, is predicting shifts in economic conditions. In response, many states have enacted legislation that indexes their minimum wages according to inflation, consumer price index and the cost of living. Workers in these states, according to the map, are much less likely to suffer severe gaps between the minimum wage and the cost of living. Projecting outwards, the map also visualizes which states have committed an increase in minimum wage according to pre-set benchmarks, with California and Connecticut leading the way, planning to reach $15/hour by 2020.
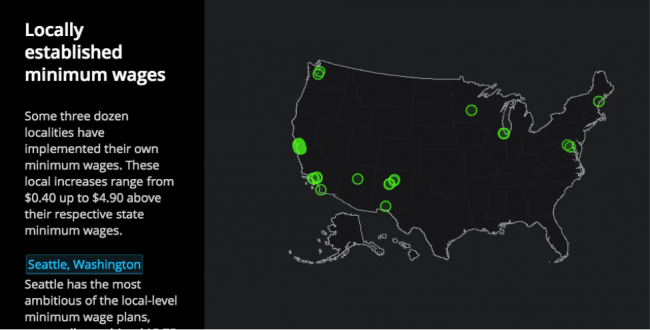
A viewer would likely notice that the least significant economic disparities cluster around the coasts, both now and projecting towards 2020. And, this trend is much starker at the local level: cities in California, in particular San Francisco and Los Angeles, the Pacific Northwest, and Portland, ME have passed local increases in the minimum wage and boast minimal, if any, gaps between the minimum and living wage. Using this visualization, other cities can identify and reproduce the effective minimum wage laws in these areas.
Esri’s story map, in addition to raising awareness about the often highly significant, if not insurmountable, economic challenges faced by minimum-wage workers across the country, provides a powerful tool for advocates of raising the hourly rate. By illustrating not only the areas where minimum-wage workers are most unable to meet their basic needs, the map demonstrates the impact of legislation in mitigating this economic disadvantage. The effectiveness of raising the minimum wage has been hotly debated – at the local, state and federal level – for years. This map provides another perspective, helping policymakers create a wage that works for all residents.

 Jess Weaver is a Research Assistant and Writer for Data-Smart City Solutions. Before joining the Ash Center, Jess worked as a researcher on a field mapping project on civic media for the MacArthur Foundation while completing her Master’s degree in Civic Media, Art and Practice out of the Emerson College Engagement Lab. She spent the bulk of her career in nonprofit strategic communications and corporate social responsibility, most recently as the Communications Director for Essential Partners, a Boston-based nonprofit that equips individuals and communities to engage in constructive dialogue across differences in identity.
