- November 26, 2018
- Public Health
In 2017, 72,306 people in the US died by drug overdose; an all-time high. Of those, 49,068 involved the use of opioids, according to the National Institutes of Health (NIH), fueling year-over-year increases in overall drug overdoses. That’s roughly 134 people that overdose and die every day on opioids. This of course follows an assertion in the late 1990s from pharmaceutical companies that “patients would not become addicted to opioid pain relievers.”

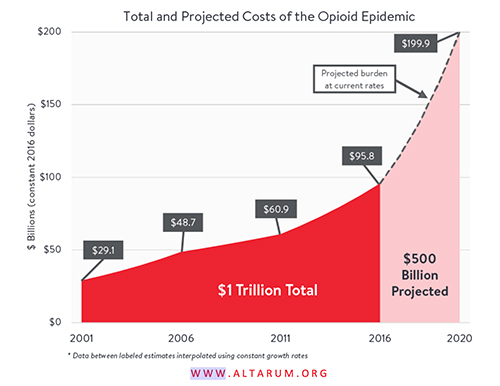
Beyond the loss of life, the opioid epidemic comes at enormous economic costs. According to the health research and consulting institute Altarum, the opioid epidemic cost the US economy $1 trillion between 2001 and 2017 with costs going up year after year. In 2001 these costs stood at $29.1 billion and in 2017, these costs ballooned to $115 billion. They have also projected that the cost burden will total an additional $500 billion between 2018 and 2020. This trend mirrors that of the two graphs above.
This is a nationwide problem, with every state impacted in some capacity. One community’s response highlights the value of a comprehensive, data-driven approach.
Northern Kentucky Health Department Fights Opioid Overdoses with Mapping and Analytics
According to the CDC, from 2000 to 2016 the Commonwealth of Kentucky had one of the highest rates of opioid overdose deaths at 21.5 per 100,000. To see how this compares to the rest of the country, please go to this interactive map created by PolicyMap.
In 2017, the overdose death rate for all drugs in Kentucky was 33 per 100,000. This rate was even higher in Northern Kentucky (NKY), where the rate jumped to 55 per 100,000. Faced with this crisis and the urgent need to save lives, the Northern Kentucky Health Department (NKY Health) decided to harness the power of data to drive an effective response.
NKY Health tasked its GIS team with creating a central data repository for the Heroin Impact Response Team (HIRT), a grassroots organization created in 2012 to fight the opioid epidemic in NKY. NKY (for the purposes of these efforts) is comprised of eight counties (including four from the NKY Health district), all of which previously collected and held their own data and whose governmental entities worked largely independently of one another. To address the problem most effectively, data from each county had to be consolidated to enable efforts to extend across jurisdictions. The process of creating the repository also helped create stronger relationships with the government agencies and stakeholders involved.
This data became the driving force behind local efforts to tackle the opioid epidemic. Several agencies and public officials worked together to map out the data, identify trends, and push for a unified, place-based strategic response down to the zip-code level. Two examples of place-based efforts made possible by this data are the Naloxone Locator and the expansion of the Syringe Access Exchange Program (SAEP). The Naloxone Locator enables NKY community members to use their smartphones to locate pharmacies and agencies in the area that carry naloxone (Narcan), an overdose-reversing drug. The app has been used nearly 2,000 times since going live in January 2017. The SAEP expansion increased the number of SAEP facilities in NKY from two to four, helping protect drug users from diseases like Hepatitis C and HIV by providing sterile syringes and safe needle disposal. These efforts helped NKY bring to a halt the rate at which opioid overdose deaths were increasing: in the last two years, opioid overdose deaths have plateaued.
The map displays information like where heroin-related arrests have been made, where opioid-related EMS responses have occurred, how many opioid-related Emergency Department visits have been made, how many opioid-related hospitalizations have occurred, and opioid prescription rates of area communities. It also explains HIRT’s Six Pillar response to the problem which includes: Prevention, Protection/Harm Reduction, Treatment, Support/Recovery, Supply Reduction and Advocacy. It shows where exactly these responses efforts are being implemented and why they are happening where they are.
You can explore this map below to see just how data and mapping have driven the efforts underway in NKY.
Educating the Public was the Key to NKY’s Success
The power of this map and the success of these efforts weren’t due solely to data and mapping. In an interview, NKY Health GIS Manager Ned Kalapasev and Public Health Informatics Manager, Debbie Young stressed that perhaps the greatest impact came from the map’s emphasis on educating the public about how this problem impacted them “in their own backyards.” They also noted that the map was incredibly effective in helping the public understand that even if they are not directly impacted by the problem, they are being indirectly impacted by the reallocation of tax dollars, as well as city, county, state and hospital resources. If someone is impacted directly by the crisis, they can see exactly how their government is working to help.
Educating the public with this map also helped quell the public’s concerns over the Naloxone Locator and expansion of SAEP, two very controversial public health efforts. It explains the data and efforts being undertaken in very simple terms while also providing access to additional resources for those who want to dig further into the data. If desired, map viewers can look back at seven years’ worth of data to see how the problem has progressed.
Since its release, the GEOStory of Opioid Addiction has been viewed well over 23,000 times, enabling the public to see for themselves how these collaborative efforts have addressed the opioid epidemic in NKY.