- February 5, 2018
- Civic Data
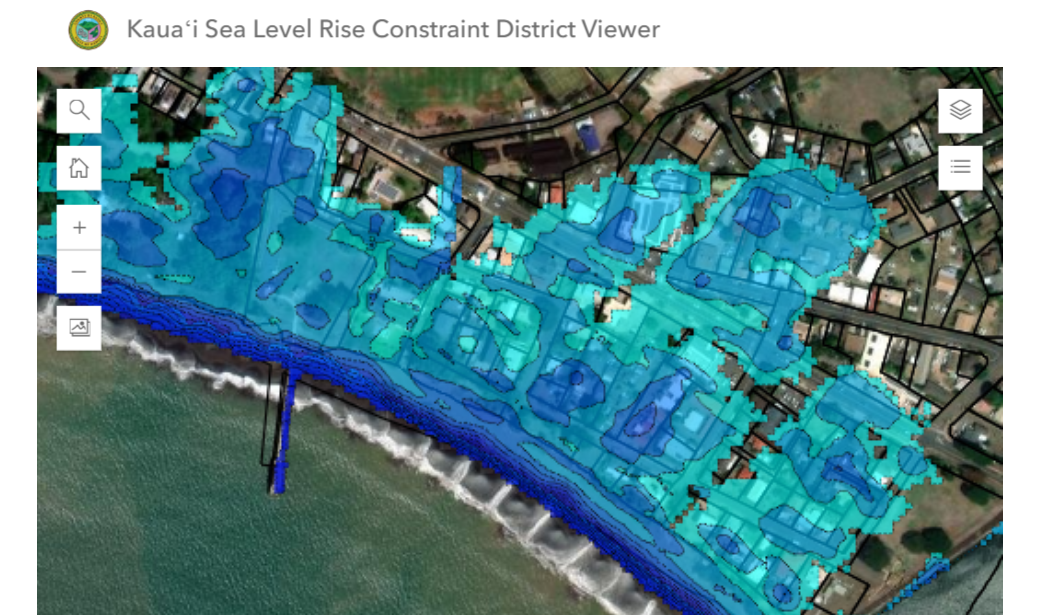
 Map: Opportunity Zone Qualification
Geographic Area: United States
Year Published: 2018
Goal: Increase awareness of areas qualified for the Opportunity Zone program.
Datasets: 2016 American Community Survey
Complementing Harvard’s Map of the Month series, each week, Map Monday highlights a data visualization that enhances understanding of or helps resolve a critical civic issue.
It’s pretty likely that most Americans didn’t read the tax bill. And even those who did probably didn’t get to a provision on page 130 designed to encourage economic development in our country’s most depressed regions, a policy that has attracted impressive bipartisan support.
However, this provision could be critically important to cities, bringing much-needed investment to underserved communities. Right now, investors hold tremendous wealth in unrealized capital gains in stocks and mutual funds— a significant untapped resource for economic development. The new provision offers investors a fiscally-sound opportunity to invest in underserved or underperforming areas on the verge of recovery (similar to funding a startup on the brink of scaling up). But the clock is ticking for governments to take advantage of this policy – and the capital behind it.
Led by Republican Senator Tim Scott and Democratic Senator Cory Booker, Congress passed the “Investing in Opportunity Act” in 2017, establishing designations called “Opportunity Zones,” which encourage long-term investments in low-income urban and rural communities across the country. The Opportunity Zones program provides a tax incentive for investors to re-invest their unrealized capital gains into so-called “Opportunity Funds.” These funds apportion at least 90 percent of their capital to specific areas designated by the chief executives of every U.S. state and territory.
In light of this emerging opportunity Esri recently mapped all census tracts across the United States to determine their qualification for the Opportunity Zone program. Users can click into each highlighted tract to view its qualification status, the median income (in comparison to the county’s overall median income), and the percent of the population living below the poverty line.
The selection process, however, will not be without its external (political) influences and inevitably subject to criticism, particularly in a time of such considerable disparity in economic recovery between urban and rural communities. To that end, maps like this one may end up serving as much as a tool for citizen advocacy or coalitions such as chambers of commerce to make the case for their community’s own designation in the days leading up to the final decision. Mayors and governors across the country certainly face tough decisions – with high financial stakes – and little time to make them.
Time to read up. Hopefully they’ll make it further than the rest of us.
 Jess Weaver is a Research Assistant and Writer for Data-Smart City Solutions. Before joining the Ash Center, Jess worked as a researcher on a field mapping project on civic media for the MacArthur Foundation while completing her Master’s degree in Civic Media, Art and Practice out of the Emerson College Engagement Lab. She spent the bulk of her career in nonprofit strategic communications and corporate social responsibility, most recently as the Communications Director for Essential Partners, a Boston-based nonprofit that equips individuals and communities to engage in constructive dialogue across differences in identity.