As more and more
cities are adopting data-driven governance, metropolitan authorities are now increasingly using data to serve their regional needs. When operating as siloes, metro areas miss out on opportunities to collaborate and share data for a common goal. Increased housing costs, climate change, and transit equity are issues that transcend city boundaries, and smart data sharing improves services for all regional residents. In the Portland, Oregon, area a new instrument is demonstrating how regional economic goals can be accomplished through smart data sharing.
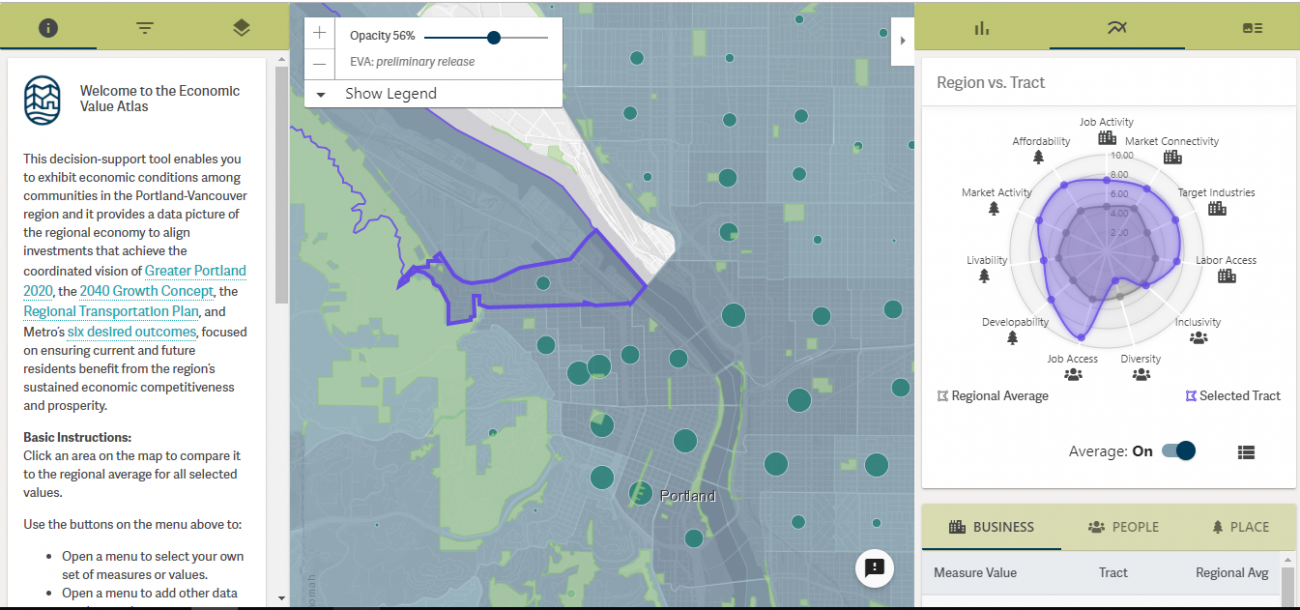
In June, the Brookings Institute released the Economic Value Atlas (EVA), a report and a data tool developed with Metro, greater Portland’s metropolitan planning organization. The EVA’s main goal is to support the region’s economic objectives by combining and analyzing data from land use planning, economic development, and infrastructure in the greater Portland and Vancouver, Canada, region. This combined data was first used to build a mapping application, an analysis tool that helps reveal areas for investment and where the regional economy could be strengthened. The secondary purpose of the EVA is to bring together metropolitan stakeholders around shared, transparent data, so they can develop policy reforms from a collaborative place.
The Tool
Usability and data selection were concerns from the beginning. Not every area tracked data the same way, and some didn’t track certain measures at all. Despite knowing that the tool would be complex, organization of the data and the user experience was important. Overwhelming the user would result in abandonment. To that end, Brookings and Metro staff worked on the database while Metro coders and developers worked to build a flexible, customizable tool. They organized the data on three different tiers; metropolitan, community, and overlay. Not all data is available in all levels and sublevels, so the overlay acts as a supplemental layer to display data that doesn’t always correspond with other areas. Many of the metrics can be toggled on and off, to allow several permutations without overloading the users.
As the EVA report explains, this is a tool that “does not shy away from complexity.” There are several layers, measures, and breakdowns, a reflection of the diverse group of stakeholders and their varying areas of interest. Organizing around the Greater Portland 2020 framework, Metro convened public and private partners to view their area of expertise through an economic development lens. From there, a set of shared values emerged to guide the stakeholder group and inform how they used the EVA tool.
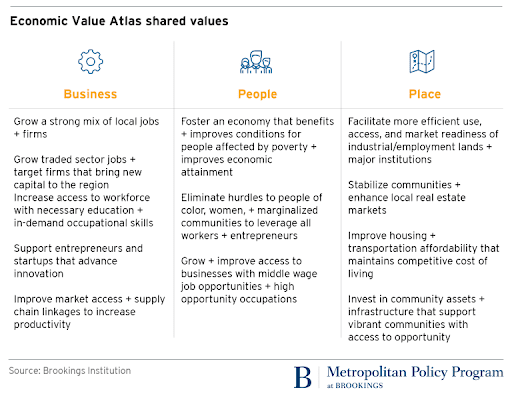
ACCESSIBLE VALUES LIST AVAILABLE HERE.
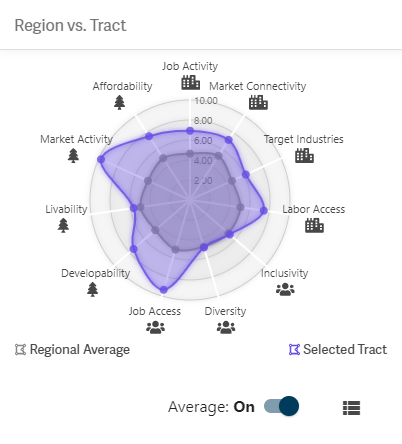
Each value aligns with a distinct economic development indicator, which can be measured and compared across the region. Census tracts are highlighted and compared with the regional average on indicators such as inclusivity, affordability, and job activity. Each of those can be further broken down; job activity includes goods-producing jobs, tradable industry, local service industry, and government jobs.
Real-World Application
 The EVA can address a series of timely challenges around housing, land use, and economic mobility. Amazon recently built a large warehouse in the Portland area, “exactly where the EVA suggested they should: a logistics- and land-rich neighborhood with easy access for entry-level workers.” Based on market connectivity, labor access, and buildable land data, regional stakeholders were able to pinpointed an optimal location. This is just one example of how the EVA can guide economic development; the tool is still under construction as the developers add more features and data. Metro staff are also running demonstrations for public, private, and nonprofit stakeholders to encourage collaboration and EVA use.
A tool like this that connects land use and transit with economic development has the potential to transform how regional governance operates. The opportunity to design metropolitan policies from a shared, data-driven space should be the new model for regional planning and investment.