- September 27, 2017
- Map of the Month
Baltimore is a city that embraces the arts – from world-class cultural institutions such as the Baltimore Museum of Arts and Enoch Pratt Free Library to the innumerable murals lining alleys and avenues throughout the city. In the eyes of many, this cultural bounty defines the city’s spirit. In the words of filmmaker and Charm City cultural icon John Waters, “You can look far and wide, but you'll never discover a stranger city with such extreme style. It's as if every eccentric in the South decided to move north, ran out of gas in Baltimore, and decided to stay.”
And yet, along with many other cities that possess a rich cultural tradition, Baltimore has confronted a critical question: whom do these cultural institutions serve? Evidence from New York City and Miami-Dade County has suggested that arts and culture funding, much like other city resources, may be distributed unequally. However, a comprehensive examination of art inequalities and their effects has been lacking.
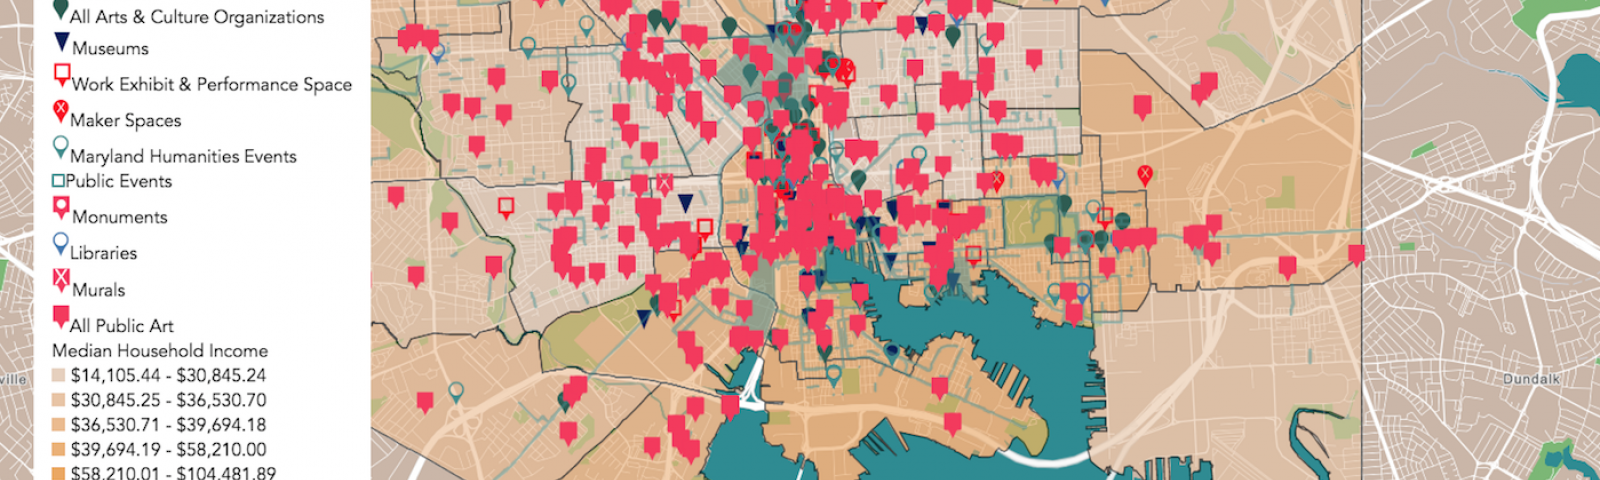
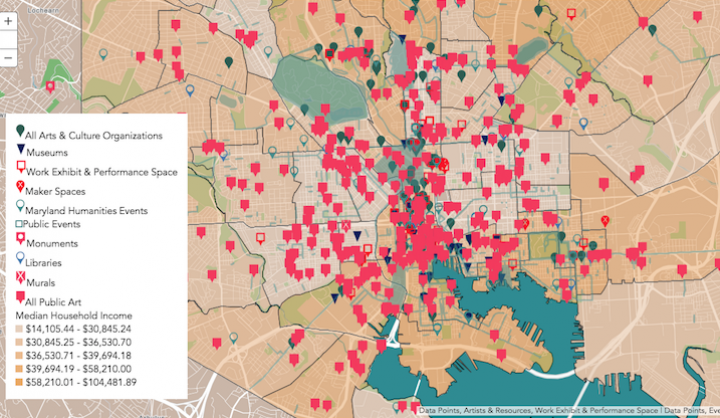
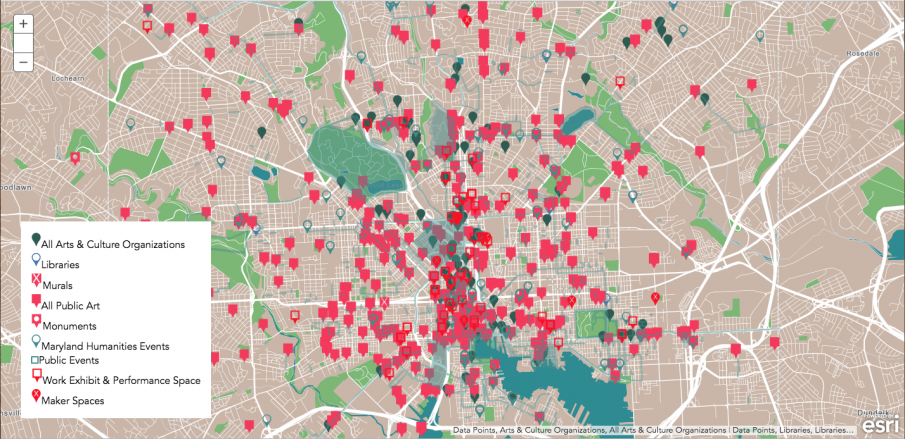
The Baltimore Neighborhood Indicators Alliance- Jacob France Institute (BNIA-JFI)—a research unit at the University of Baltimore primarily focused on providing open access to data throughout Baltimore—wanted to fill this gap. Thanks to the vision of Baltimore Office of Promotion & The Arts (BOPA) Board Member Alyce Myatt, BNIA decided to create a data visualization of cultural data across the city. The city brought on arts and culture fellow and 2014 graduate of Harvard’s Graduate School of Design Christine Hwang to expand Baltimore’s inventory of arts and culture data and aid in the creation of GEOLOOM co>map. With funding provided by the National Endowment for the Arts, the Baltimore Development Corporation, and a number of local philanthropic foundations, Hwang worked to develop this searchable and interactive map of Baltimore, presenting users with a bevy of information about arts and cultural resources overlaid with key community indicators such as census demographics, children and family health, and crime and safety data. Hwang explained that the co in GEOLOOM co>map stands for community, collaboration, and cohesion in Baltimore. “We wanted to demonstrate how impactful the arts are to Baltimore and allow people to see where resources are being allocated and where there may be unmet demands,” she said.
The co>map has been selected as Harvard’s Map of the Month, a program that recognizes the best maps and data visualizations created by governments and nonprofits to address a pressing civic issue. The map was chosen in part for the novelty of the issue addressed, enhancing understanding of an often-overlooked determinant and signal of persistent social and economic inequality. Quinton Mayne, an associate professor of public policy at Harvard Kennedy School and a resident faculty affiliate of the Ash Center for Democratic Governance and Innovation, explained, “In the years since the Great Recession, some cities have come to realize that community arts and culture are a key source of resilience. They help individuals and communities face the tough times through their direct economic benefits but also, crucially, as engines of key intangibles – neighborhood pride, a sense of efficacy, and social cohesion.” The map’s analysis of this issue is nuanced and accessible, incorporating data from a number of different sources in a smart, easy to use UX.
In order to build the tool, BNIA enlisted the help of a working group representing a variety of potential users to help ensure that the appearance and function of the map was accessible and intuitive. BNIA issued a request for proposals (RFP) for a GIS developer, ultimately contracting with Washington, D.C.-based company Blue Raster, and tapped TJ O’Donnell, a professor at University of Baltimore, as designer. Throughout the process, BNIA collaborated with the developer and rigorously user-tested the visualization until landing on a final product.
One of the most difficult elements of building the tool was tracking down missing culture data. “We made this map knowing that maybe 80 percent of what's out there for arts and cultural organizations is available through a maintained inventory or informal list but finding that final 20 percent would be a huge challenge,” said Hwang. The GEOLOOM co>map team turned to crowdsourcing to help fill in information about artist studios or murals that couldn’t necessarily be scraped from existing municipal databases, inviting public input via an Add Data tab on the map. Neighborhood and community groups, such as Belair-Edison Neighborhoods, Inc., have contributed inventories of public art that did not exist in these databases, demonstrating both the presence of arts and culture in neighborhoods as well as a desire to access more funding for creative placemaking. Investing in in Belair-Edison, which includes a main street situated on Route 1, could inspire people driving through to stop in the neighborhood, learn about arts and culture in Baltimore, and spend their dollars in the city.
The map incorporates data from unique sources, such as event permits filed with the city’s department of transportation “so that we get festivals, block parties, any types of protests, marches, so on, so anything that's happening outside of homes, and outside of buildings, really that contributes to community life,” added Hwang. Other data comes from a variety of sources including citywide organizations, such as the Baltimore Office of Promotion in the Arts, the Greater Baltimore Culture Alliance, and the Baltimore National Heritage Area, and smaller organizations, such as Arts Every Day, a group connecting arts programming and schools.
Thanks to this rigorous data collection process, GEOLOOM is able to uncover hidden gems within the Baltimore landscape. Kim Clark, Executive Vice President of the Baltimore Development Corporation—a non-profit that serves as the economic development agency for the city and funded GEOLOOM—explained, “We saw this as a great economic development tool. By mapping assets throughout the city, people better understand what’s going on in their community.” GEOLOOM brings attention to attractions that might otherwise go under the radar. “It’s not just about major museums, but it’s about the Everyman Theatre or the Single Carrot Theatre,” Clark explained. “People look at the map and realize, ‘I’ve got this really cool theatre down the street.’”
The map also shows people outside of Baltimore what the city has to offer. “People don’t realize there’s so much art and entertainment in the city,” said Clark. Seeing the city’s robust artistic offerings can attract more visitors or even new residents and businesses looking to relocate in a cultural hub.
And while the city is indeed saturated with cultural landmarks, GEOLOOM can also serve as a tool for residents in neighborhoods underserved by arts and entertainment. BNIA-JFI has been actively engaged in community outreach, encouraging Baltimore residents to take advantage of the map. “One noticeable thing that we've discovered in talking to individual communities is they'll say things like ‘we've been advocating for a library in our neighborhood. How do we use this map to show the city we need the library in our neighborhood?’” said Hwang. “And we can demonstrate with our database that there are a high number of people who have library membership in the neighborhood, but there's no library or similar resource.”
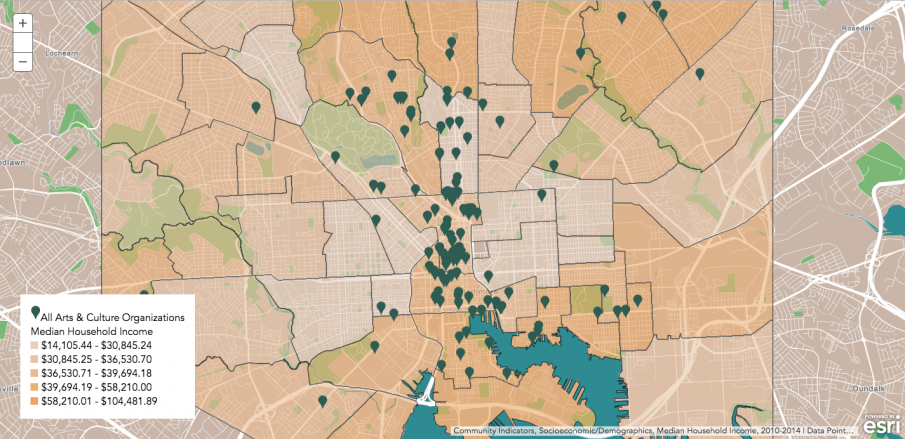
City agencies have similarly sought to use the map to address inequalities. “They want to see where there are gaps in their funding, and yet where maybe artists are living or where there is a need for support for a certain type of arts and culture that is underinvested,” said Hwang. Clark echoed these intentions, explaining, “The tool provides an optic for seeing where the arts and culture gaps are. That allows the city to create places where people want to be.”
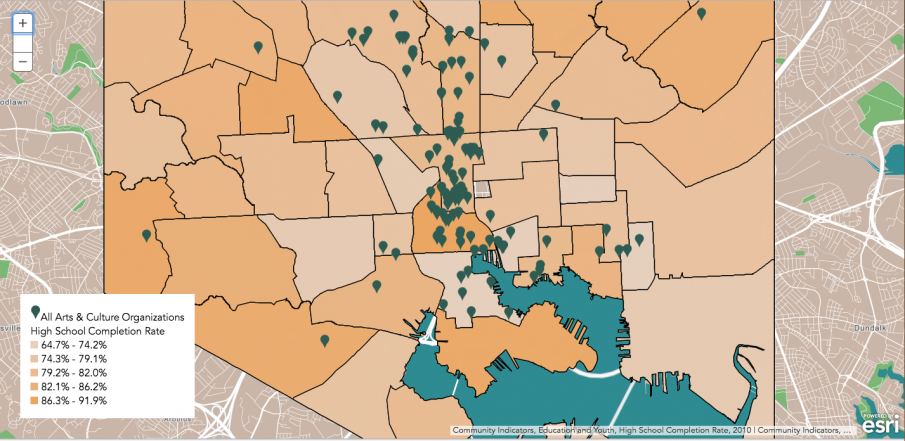
Clark’s comments introduce some of the most interesting and important interdisciplinary questions that city agencies or researchers can investigate using the map. For example, what is the relationship between the presence of cultural institutions and crime, educational outcomes, or socioeconomic status? Might unequal funding for the arts perpetuate existing inequalities in these areas?
Hwang is hoping that Baltimore’s work will inspire other cities to undertake similar arts and culture data mapping efforts. BNIA created a handbook, which highlights the variety of stakeholders who contributed to the creation of the map, for other cities to replicate the success of the GEOLOOM co>map. “We want to show other cities that they have the tools to launch similar projects,” said Hwang.
If you have a map that you would like to submit for consideration as Map of the Month, submissions are accepted on a rolling basis here.
 Chris Bousquet is a PhD student in philosophy at Syracuse University. Prior to that, Chris was a Research Assistant/Writer for Data-Smart City Solutions. Chris holds a bachelor’s degree from Hamilton College.
 Daniel Harsha is the Associate Director for Communications and Government Relations at the Ash Center. Previously, Harsha served as Communications Director and Senior Professional Staff Member for the Democratic staff of the House Foreign Affairs Committee and Senior Legislative Assistant to Congressman Howard Berman (D-CA). Harsha holds a bachelor’s degree in Politics from Oberlin College and a master’s degree in Middle East Politics from the School of Oriental and African Studies (SOAS), University of London.