- June 3, 2020
- Data Visualization
On any given day in America, minority communities fall victim to many adverse health outcomes at a disproportionate rate compared to their white counterparts. These disparities persist due to longstanding structural and social conditions that increase their susceptibility to health problems such as diabetes, hypertension and heart disease. With COVID-19, like many other viruses or diseases that attack the lungs, the existence of these conditions puts those who have them at greater risk of experiencing serious complications or even death if they catch the virus.
This is something that public health experts and emergency responders have been well aware of for years. Several years ago, the Centers for Disease Control and Prevention (CDC) created a Social Vulnerability Index (SVI) map to help emergency responders prepare for and respond to disasters with an emphasis on identifying the communities most at risk of experiencing the worst outcomes. Nevertheless, minority communities are being adversely impacted by this pandemic at far greater rates. Many states are still catching up in terms of collecting and releasing data on race, but one local government in the US was ahead of the curve: Milwaukee County.
One year ago, well before COVID-19, the County and City of Milwaukee had declared racism a public health crisis. This designation put racial equity at the forefront of public policy decision making, placing the needs of underserved minority communities at the top of the consideration criteria.
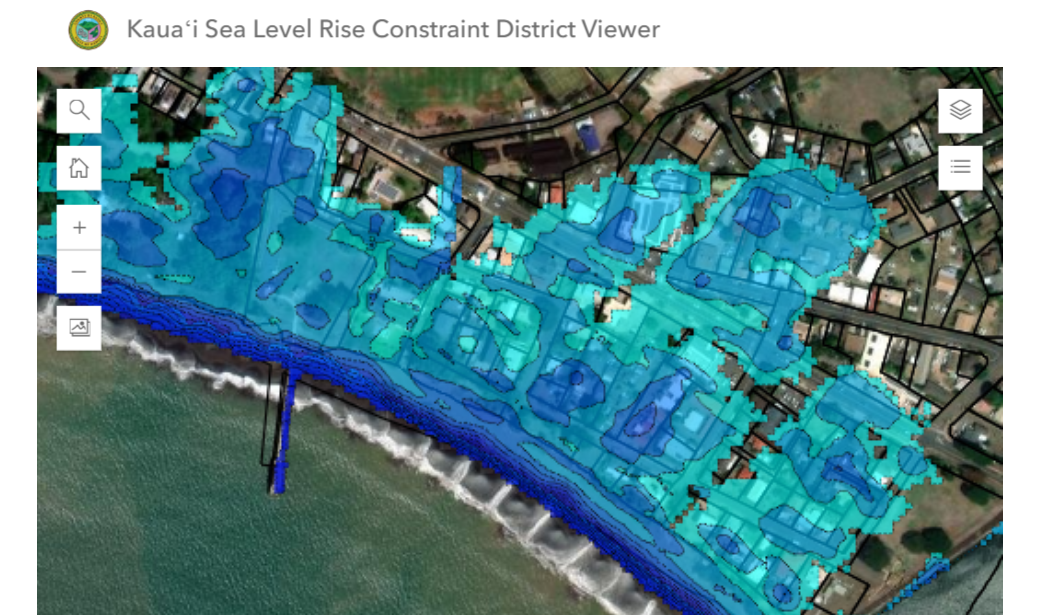
When the virus began to appear in the county, officials wanted to ensure that they got ahead of racial disparities in COVID’s impact. To do that, the county’s GIS and data analytics teams, at the direction of the County Medical Director, Ben Weston, MD, MPH, built a highly detailed dashboard with a map of their communities’ racial and socioeconomic makeup. They then layered on data about confirmed positive cases by race, age and gender. The data is updated two times per day, a process that takes the team up to two hours per update, even with some automation built in.
The dashboard allows users to view the cumulative number of cases, as well as new cases in the last seven to 14 days by municipality or zip code. A wide range of layers can be added to the map including the CDC’s SVI, case rates per 100,000 residents, as well as demographic data on income, age range, and race/ethnicity. Very recently, the team added additional data on testing and hospital capacity as well. In exploring the data layers, users will find that the county’s poorest and most racially diverse areas are getting hit the hardest in terms of total number, as well as the rate of cases and deaths. You can explore the interactive map here.
When designing the dashboard, the goal of the team was to provide a high level view of daily trends and conditions on the ground across Milwaukee County, and allow users that want more insight the ability to explore a wide range of data layers. Ultimately, the higher level goal was to be able to monitor conditions across vulnerable neighborhoods and allocate resources where they are most needed. The tool has been critical in shaping the county’s response.
When asked in an interview about the process for pulling the data together for this dashboard, Weston noted that it has been a big lift to get all of the data layers on there and to keep them updated. However, he said the team has done a fantastic job keeping up, building in automation, and developing a cadence for feeding in data as the caseload has increased. Weston emphasized that it is important to the county that they keep this information public for two reasons: First, it is about information sharing and transparency internally and externally, ensuring that everyone is communicating using the same data. Second, it is about holding the county accountable for the well-being of their most vulnerable residents.
Weston acknowledged the difficulty in accurately collecting data on race, particularly in moments like this, but has been working to ensure that this data is collected to enable an equitable response. He said that, typically, in public health this data is “often not collected, or collected inaccurately, due to discomfort in asking the question about race. So, we are limited by the system’s ability to effectively represent race, ethnicity, and the nuances that lie therein.” However, he continued on to say that it is important to have this data because it “forces not only ourselves, but the general public to have at times uncomfortable but very necessary conversations about how our society is structured, and how change must be made to help make for a more equitable world.”
At the time of publication, black residents account for 39 percent of confirmed cases and 49 percent of those who have died in Milwaukee County despite accounting for just a quarter of the population. White residents account for 25 percent of confirmed cases and 42 percent of deaths despite being just over half of the population. In six percent of cases, the race of the individual is not known.
As a public health professional, Weston is excited that he now has this tool at his disposal, not just for the current response efforts, but for future public health emergencies. “We have never had a map like this before,” he said. “Never something that is this detailed or functional... Now that we are equipped with this tool, I hope we can commit to maintaining and supporting it for future use.”
Beyond the purposes of public health emergency response, Weston said that the silver lining in this is that we are “having a focused conversation, not just as the Milwaukee community, but as a nation, about race and inequality in our society. We now see what the impact can be when we fail to address these disparities…. we have no excuse after this.”