

-
April 14, 2015
- Regulation
INTRODUCTION
Weighing the pros and cons of different choices is a natural part of any decision-making process. By making this process more explicit, benefit-cost analysis provides significant advantages for policymakers as well as for those ultimately affected by their decisions. It develops the evidence needed to identify the policy option likely to provide the largest net benefits to society, promotes understanding of the consequences of different choices, aids in predicting outcomes that might be otherwise unexpected, and fosters effective communication of the reasoning that underlies the decision.
Benefit-cost analysis is required for major national regulations in the United States and other countries, and is increasingly used at the state level. As a result, many completed analyses as well as substantial guidance on best practices are available. While likely to be very useful at the local level, increased application will require designing approaches that take into account the time and resources available as well as broadening the research base to more extensively cover issues of interest to municipalities.
This article introduces the concepts that underlie the conduct of benefit-cost analysis, describes the major analytic components, and discusses how to tailor the analysis to the characteristics of the policy and the resources available. It concludes with a list of references for those interested in learning more.
WHAT IS BENEFIT-COST ANALYSIS?
Benefit-cost analysis (sometimes referred as cost-benefit analysis) is a well-established and widely-used approach for collecting, organizing, and analyzing information on policy impacts. If well conducted, it provides an objective, unbiased assessment of the positive and negative effects of alternative policies. It takes into account both quantifiable and non-quantifiable impacts and describes the implications of related uncertainties for decision-making.
Such analysis relies on monetary indicators of value, exploring the extent to which those affected are willing to trade off consumption of other goods and services for various policy outcomes. Money is not important per se; rather, it is used as a convenient measuring rod to compare disparate impacts. Denoting values in monetary terms has the advantage of providing information on the intensity as well as the direction of preferences. It also mimics the actual trade-offs implicit in most policy decisions. If a city chooses to spend more on one policy, it will have fewer resources available to devote to other purposes – including other policies that address the same or similar problems.
Benefit-cost analysis is based on the principles of welfare economics. Consistent with this framework, analysts generally assume that each individual is the best judge of his or her own welfare, respecting the preferences of those affected by the policy. The analysis is intended to provide decision-makers with information on how those affected value the costs and benefits they are likely to experience.
Benefit-cost analysis focuses on estimating the opportunity costs associated with different policy choices. It explicitly recognizes that using resources (such as labor or raw materials) for one purpose means that they are not available for other productive uses. Thus the value of a resource is determined by its most productive (or beneficial) use.
Within this context, value is determined by the amount of money individuals are willing to exchange for a good or service. Choosing to buy a good or service presumably indicates that the individual values that item more than the other things he or she could have used that money to purchase. These values can be aggregated across individuals to determine the value of the good or service to society.
The goal of benefit-cost analysis is to estimate the net effect of a policy on all affected. It identifies the option (including the option of no action) that reflects the most economically efficient allocation of resources, yielding the largest positive net benefits to society. The analytic results can then be combined with information on legal requirements, general policy goals, political feasibility, and other factors to develop the evidence base for decision-making.
How the impacts are distributed – who pays the costs and who accrues the benefits – is typically assessed separately. Analysts generally distinguish between resource costs and transfers. Transfers are monetary payments between individuals or groups that do not affect the total resources available to society, such as some types of taxes, fees, and surcharges. They are a benefit to recipients and a cost to payers, with zero net effect. While transfers can be ignored in benefit-cost analysis, they are often of interest to policymakers and must considered when assessing the distribution of the impacts.
Conducting benefit-cost analysis has its own benefits and costs. By improving the evidence available, it increases the likelihood that policy decisions will provide net benefits to society. It supplies a record of the data, assumptions, and analyses considered, aids decision-makers and stakeholders in clarifying areas of agreement and disagreement, and supports effective communication and policy implementation.
The costs of conducting benefit-cost analyses include the need to devote staff and funds to preparing these assessments rather than to other tasks. To ensure the efficient use of these resources, the analysis needs to be carefully tailored to focus on providing the information that is most important for decision-making. Screening analysis, as discussed later, is a useful tool for targeting efforts to ensure that the analysis itself is cost-beneficial.
WHAT ARE THE BASIC COMPONENTS OF A BENEFIT-COST ANALYSIS?
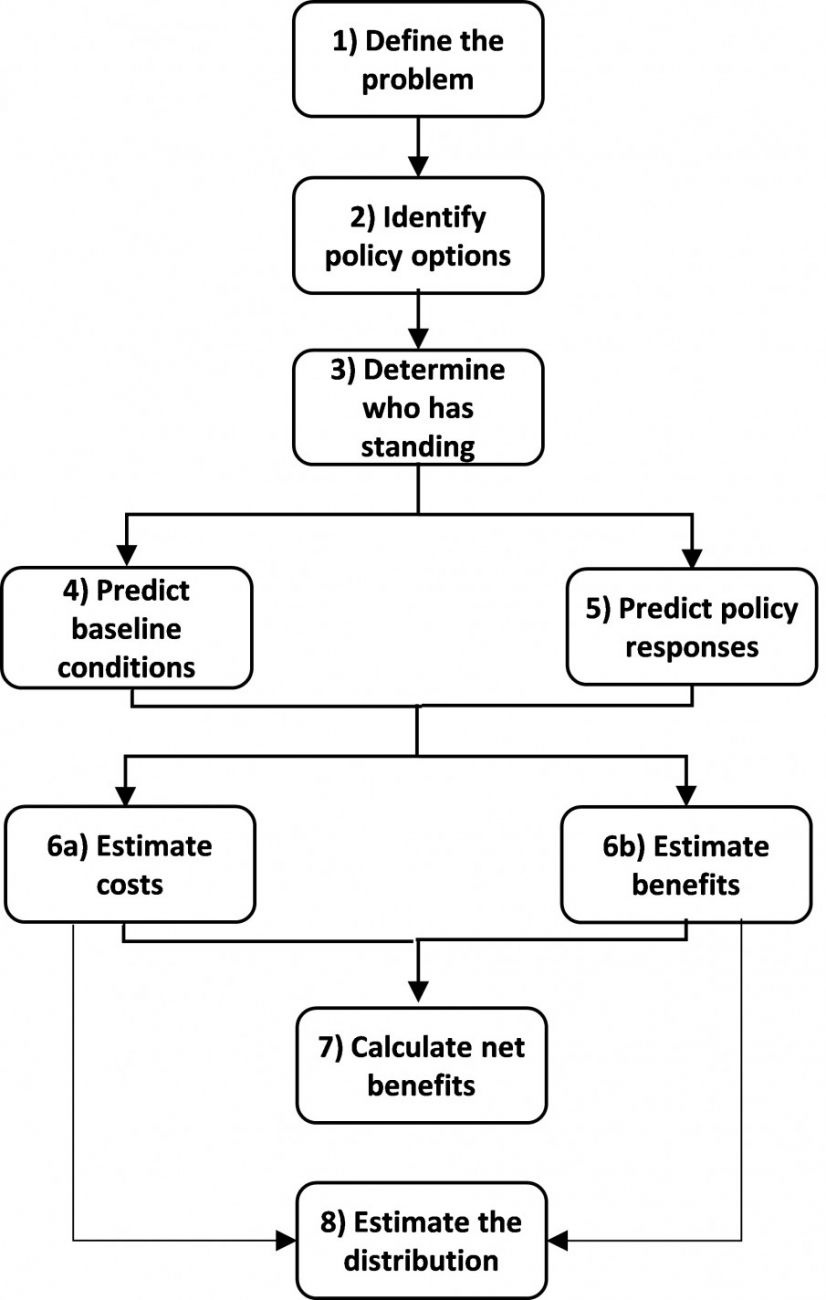
1) Define the problem
The first step is to clearly define the problem to be addressed. This may, for example, involve reducing the risk of foodborne illness or traffic accidents from specific causes, or increasing the efficiency of a process such as permitting. Typically, these problems involve failures of the private market to provide adequate levels of protection, appropriate levels of competition, or needed information – or reflect the desire to address other social goals such as increasing the efficiency of government operations, protecting privacy, or promoting fairness.
2) Identify policy options
Next, analysts should identify a reasonable number of alternative policies that could be implemented to address the problem. Considering only one option can lead decision-makers to ignore others that may be more cost-beneficial; ideally three or more options should be assessed. These options may vary, for example, in the type of intervention (such as information provision versus performance standards), the stringency of the requirements, the types of individuals or establishments affected, or the ways in which the policies are enforced.
3) Determine who has standing
“Standing” refers to identifying whose benefits and costs count. The analysis may, for example, consider impacts on all those who reside or work in the city, the metropolitan area, the county, or the state. At times, it may be useful to report results at different levels of aggregation (e.g., for the city alone and for the city and the surrounding metropolitan area combined), to ascertain how the determination of standing affects the conclusions.
4) Predict baseline conditions
Each policy option is compared to a “no action” baseline that reflects predicted future conditions in the absence of the policy. This baseline takes into account expected trends, recognizing that current conditions may not persist over time. For example, the number and types of local businesses and the size and characteristics of the population are likely to change in ways that may affect the incremental impacts of the policy.
5) Predict policy responses
Predicting responses to the policy is often the most difficult step, given the evolution of baseline conditions, the complexity of the policy options, the gaps in the data available, and the diversity of individuals and organizations affected. One challenge is ensuring that changes that are likely to occur under the baseline are not inappropriately attributed to the policy. For example, drug addiction rates may be decreasing for reasons unassociated with the implementation of a particular treatment program. Another challenge is estimating the behavioral changes that are attributable to a policy. This can be particularly difficult for policies involving information provision. Knowing that more information will become available is not sufficient to estimate its impact on social welfare; analysts must also consider how people will respond. For example, requiring that restaurants post inspection grades will reduce the incidence of foodborne illness only to the extent that restaurants and their patrons change their behavior in response. It is often useful to map relationships between the policy, the intermediate outcomes, and the ultimate effects on social welfare as a flowchart, influence diagram, or logic model to aid in clarifying the causal connections.
6) Estimate costs and benefits
This step involves estimating the costs and benefits that result from the policy responses. Whether a particular impact is categorized as a “cost” or “benefit” may vary across analyses. To avoid confusion, analysts should follow a consistent approach which categorizes as costs those investments or inputs needed to achieve the policy goals and as benefits the intended policy outcomes as well as any countervailing effects. For example, a policy that requires bicyclists to wear helmets may decrease injury risks for many riders, but may also encourage some to exercise less caution and hence increase their risks. Both the expected decreases and increases in risk would be included in the benefits estimates.
When estimating costs, analysts concentrate on the reallocation of resources required to implement the policy; i.e., the opportunity costs of using resources to carry out the policy rather than for other purposes. These costs may be incurred by private enterprises, government agencies, or individuals. Typically, analysts focus on estimating direct costs based on market prices; at times, policy impacts may be large enough to affect these prices and supply and demand conditions in the relevant markets, in which case these market impacts should also be considered.
When estimating benefits, analysts concentrate on the impact of the policy on the welfare of those affected, taking into account any ancillary or unintended effects. In some cases, these outcomes can be valued based on market prices. For example, if a policy reduces the amount of time required for permitting and increases the time available for more productive work, wage rates can be used to estimate the value of the resulting productivity gains. Other outcomes require applying nonmarket valuation methods. As discussed in the references provided at the end of this article, because environmental and health improvements are not directly bought and sold in markets, they are instead valued based on the amounts paid for related market goods or on survey data.
7) Calculate net benefits
The final step in the benefit-cost analysis involves comparing costs and benefits to determine which option, if any, provides the largest positive net benefits. Generally, impacts in future years are discounted to reflect time preferences as well as the opportunity costs of investments made in different periods. This discounting reflects the desire to receive benefits as soon as possible and to defer costs.
When comparing costs and benefits, analysts also address the effects of uncertainty, including non-quantified effects. The goal is to ensure that decision-makers and other stakeholders understand the extent to which these uncertainties – in the data, models, and assumptions – affect the estimates of the net benefits of alternative policies. If quantification or valuation of some impacts is not possible, analysts provide related qualitative information to ensure that these effects are not under- or over-emphasized. The results aid decision-makers in understanding the confidence they should have in the results and the likely direction and magnitude of any bias.
8) Estimate the distribution
While technically outside of the benefit-cost analysis framework, assessing the distribution of the impacts is often important to decision-makers. Such analysis makes the trade-offs between economic efficiency and distributional concerns more explicit. Decision-makers may choose the economically-efficient option that maximizes net benefits, or may choose a less efficient option to ameliorate distributional impacts or achieve other policy goals. Undesirable distributional effects may be mitigated by other programs, such as those providing subsidies or tax credits to disadvantaged groups.
A key step in this analysis involves identifying which groups of organizations or individuals should be considered. When conducting distributional analysis, it is often tempting to focus solely on adverse effects on disadvantaged groups. However, such focus is problematic because it leads analysts to ignore potential beneficial effects that may be of equal or greater importance. The costs and benefits may be counterbalancing, or may differentially affect the advantaged and the disadvantaged. Typically, the distributional analysis provides descriptive information for consideration by decision-makers and stakeholders; analysts rarely assign weights to reflect distributional preferences or make normative judgments related to the fairness or equity of the impacts.
HOW CAN ANALYSTS ENSURE THAT THE COSTS OF THE ANALYSIS DO NOT EXCEED ITS BENEFITS?
Because analytic resources are limited, the ideal analysis will not assess all policy options, nor quantify all impacts, with equal precision. Conducting benefit-cost analysis requires subjecting the analysis itself to an informal benefit-cost or value-of-information test. This requires considering what types of analysis, at what levels of detail, are most important to improve the basis for policy decisions. “Importance” may depend on the likely magnitude of the impacts; it may also depend on the need to respond to questions likely to be raised by decision-makers and others.
Screening analysis is a useful tool for targeting subsequent work. Such analysis is typically based on easily accessible data and simple assumptions; its goal is to provide preliminary information on the possible direction and magnitude of the effects and to identify where additional work is most needed. For example, high-end values can be used to determine whether various types of outcomes are likely to be significant even under extreme assumptions. Depending on the results, this screening may be followed by more detailed assessment that involves collecting additional data, refining the methods used, and possibly expanding the scope of the analysis.
For national regulations, government authorities have developed approaches to categorize policies based on the magnitude and characteristics of the impacts, so as to determine the amount and types of analysis needed. The general idea is that the analysis should be proportional to its usefulness for decision-making. Cities may wish to consider developing similarly tiered approaches, which allow policies to be easily classified in terms of the amount of analysis that is appropriate. For example, relatively simple and inexpensive policy changes may receive relatively little analytic attention, particularly if they are similar to other policies that have been successfully implemented. More complex and expensive policies, and those that are more innovative, may require additional attention. In some cases, a short document that summarizes the information currently available on the topics listed in Figure 1 may suffice. In other cases, investment in substantial additional research may be desirable.
REFERENCES AND OTHER RESOURCES
Key Text
Boardman, A.E., D.H. Greenberg, A.R. Vining, and D.L. Weimer. 2011. Cost-Benefit Analysis: Concepts and Practice (Fourth Edition). Upper Saddle River, N.J.: Pearson.
Databases of Previous Studies
Washington State Institute for Public Policy Benefit-Cost Analysis Database. http://www.wsipp.wa.gov/BenefitCost
Pew-MacArthur Results First Clearinghouse Database. http://www.pewtrusts.org/en/research-and-analysis/issue-briefs/2014/09/results-first-clearinghouse-database
Guidelines for U.S. Regulatory Agencies
U.S. Department of Transportation. 2014. Benefit-Cost Analysis Analyses Guidance for TIGER Grant Applicants. http://www.dot.gov/tiger/guidance
U.S. Environmental Protection Agency. 2014. Guidelines for Preparing Economic Analysis. EPA 240-R-10-001. http://yosemite.epa.gov/ee/epa/eed.nsf/pages/guidelines.html.
U.S. Office of Management and Budget. 2003. “Circular A-4: Regulatory Analysis”. http://www.whitehouse.gov/omb/inforeg_regpol_agency_review/
U.S. Office of Management and Budget. 2010. “Agency Checklist: Regulatory Impact Analysis.” http://www.whitehouse.gov/omb/inforeg_regpol_agency_review/
U.S. Office of Management and Budget. 2011a. “Regulatory Impact Analysis: Frequently Asked Questions (FAQs).” http://www.whitehouse.gov/omb/inforeg_regpol_agency_review/
U.S. Office of Management and Budget. 2011b. “Regulatory Impact Analysis: A Primer.” http://www.whitehouse.gov/omb/inforeg_regpol_agency_review/
U.S. Small Business Administration. 2012. A Guide for Government Agencies: How to Comply with the Regulatory Flexibility Act. http://www.sba.gov/advocacy/guide-government-agencies-how-comply-regulatory-flexibility-act
Guidelines for Other Countries (Examples)
European Commission. 2009. Impact Assessment Guidelines. http://ec.europa.eu/smart-regulation/impact/index_en.htm
HM Treasury (United Kingdom). 2011. The Green Book: Appraisal and Evaluation in Central Government. https://www.gov.uk/government/publications/the-green-book-appraisal-and-evaluation-in-central-governent
Treasury Board (Canada). 2007. Canadian Cost-Benefit Analysis Guide: Regulatory Proposals http://www.tbs-sct.gc.ca/rtrap-parfa/analys/analystb-eng.asp
Special Topics
Freeman, A.M. III, J.A. Herriges, and C.L. Kling. 2014. The Measurement of Environmental and Resource Values: Theory and Methods (Third Edition). New York, N.Y.: RFF Press.
Harrington, W., R. Morgenstern, and P. Nelson. 2000. “On Accuracy of Regulatory Cost Estimates.” Journal of Policy Analysis and Management. 19(2): 297-322.
Morgan, M.G. and M. Henrion. 1990. Uncertainty: A Guide to Dealing with Uncertainty in Quantitative Risk and Policy Analysis. Cambridge, U.K.: Cambridge University Press.
Morgenstern, R. 2013. “Analyzing the Employment Impacts of Regulation.” In Does Regulation Kill Jobs? C. Coglianese, A. Finkel, and C. Carrigan (eds.). Philadelphia, P.A.: University of Pennsylvania Press.
Robinson, L.A. and J.K. Hammitt. 2013. “Skills of the Trade: Valuing Health Risk Reductions in Benefit-Cost Analysis.” Journal of Benefit-Cost Analysis. 4(1): 107-130.
DOWNLOAD PDF
 Lisa A. Robinson is a researcher at the Centers for Risk Analysis and Health Decision Science at the Harvard T.H. Chan School of Public Health. Her research and teaching focus on the use of economic analysis, particularly benefit-cost analysis, to inform policy decisions. She has spent much of her career assessing the impacts of environmental, health, and safety regulations, developing related methods, and drafting guidance. She was previously a Senior Fellow at the Harvard Kennedy School Mossavar-Rahmani Center for Business and Government and an Affiliate Fellow of its Regulatory Policy Program. In addition, she was a Principal at Industrial Economics, Incorporated; the Director of Policy, Planning, and Budget for the federal Institute of Museum Services; and an analyst at the U.S. Office of Management and Budget. She is the Past President of the Society for Benefit-Cost Analysis and serves on the editorial boards of the Journal of Benefit-Cost Analysis and Risk Analysis. She received her Master in Public Policy Degree from the Harvard Kennedy School.