- Map
- United States
- Economic Innovation Institute
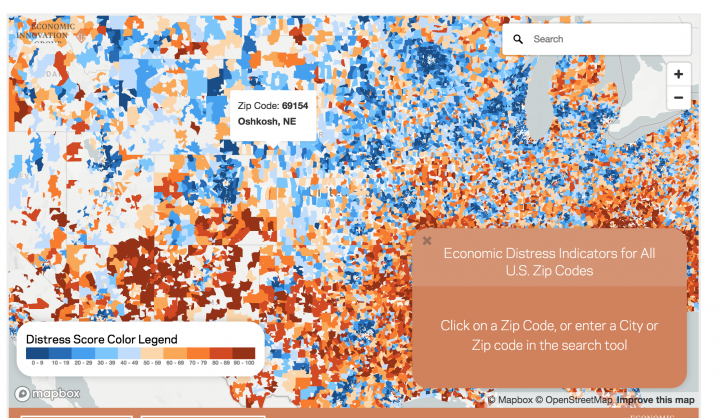
The Distressed Communities Index (DCI), a new and interactive way to visualize economic distress and prosperity across 25,000 zip codes in the U.S. The Distressed Communities Index (DCI) combines seven complementary metrics into a single holistic measure of community economic well-being. It can be calculated at multiple different scales: in this report at the zip code, city, county, and congressional district levels. In all, it captures 99 percent of the U.S. population and covers more than 26,000 zip codes and more than 3,000 counties (those with over 500 people) as well as nearly 800 cities (those with at least 50,000 people). The DCI is constructed using data from the U.S. Census Bureau's American Community Survey 5-Year Estimates for 2011-2015 and Business Patterns data from the years 2011 and 2015. The seven component metrics of the DCI are: No high school diploma: Percent of the population 25 years and older without a high school diploma or equivalent Housing vacancy rate: Percent of habitable housing that is unoccupied, excluding properties that are for seasonal, recreational, or occasional use Adults not working: Percent of the prime-age population (ages 25-64) not currently in work Poverty rate: Percent of the population living under the poverty line Median income ratio: A geography's median income expressed as a percentage of its state's median income Change in employment: Percent change in the number of jobs from 2011 to 2015 Change in business establishments: Percent change in the number of business establishments from 2011 to 2015 Each component is intended to capture a distinct aspect of well-being. The first five indicators are relatively static and descriptive, while the latter two are more dynamic and directional. All are weighted equally in the index to reflect the multifaceted nature of prosperity, distress, and the states in between. Together, they provide a more complete picture of the economic state of a community than any single indicator could on its own. Distress scores are calculated at each scale by ranking geographic units on each of the seven metrics, taking the average of those ranks, and then normalizing the average to be equivalent to a percentile. The result is a range of distress scores from 0 to 100, such that the zip code with the average rank of 13,000 out of 26,000 will register a distress score of 50.0. Given that the methodology requires ranking each geography among its peers (e.g. zip codes among zip codes and cities among cities), distress scores are not comparable across different tiers of geography. In other words, the underlying performance of a zip code and a city at the same percentile across the seven component metrics of the DCI may differ.
DATASETS
US Census (By tracking data from over 26,000 ZIP codes, the Distressed Community Index sorted cities, counties, and congressional districts into tiers based on their economic well-being: prosperous, comfortable, mid-tier, at risk, and distressed).

