- Visualization
- New York City
- New Yorker Magazine

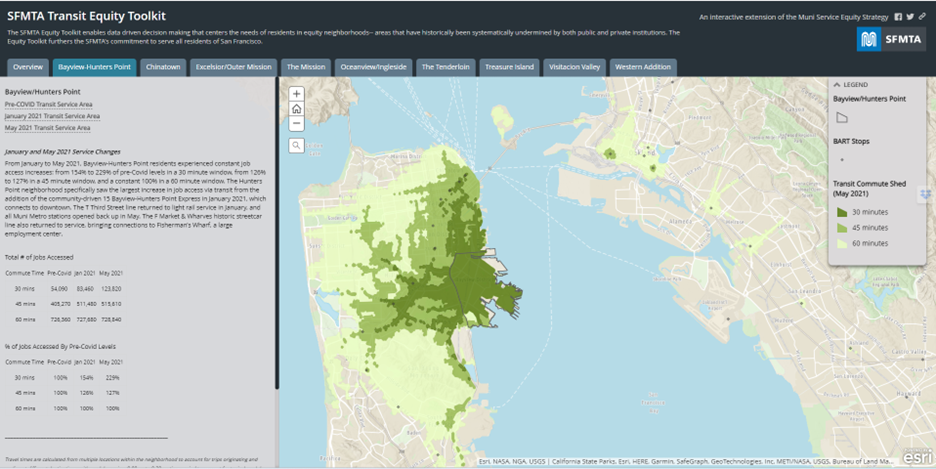
New York City has a problem with income inequality. And it's getting worse-the top of the spectrum is gaining and the bottom is losing. Along individual subway lines, earnings range from poverty to considerable wealth. The interactive infographic here charts these shifts, using data on median household income, from the U.S. Census Bureau, for census tracts with subway stations.
DATASETS
American Community Survey 2009 to 2013 (5-Year Estimates) Social Explorer 2015 GTFS data 2013 Census Block Group Shape Files